
Learn more about Six Sigma. It is the most widely used strategy for statistical quality assurance, uses data and statistical analysis to measure and improve a company’s operational performance, it Identifies and eliminates defects in manufacturing and service-related processes. It is basically a method that provides organizations tools to improve the capability of their business processes. This increase in performance and decrease in process variation lead to defect reduction and improvement in profits, employee morale, and quality of products or services.
The Six Sigma concept was developed at Motorola in the 1980s. Six Sigma can be viewed as a philosophy, a technique, or a goal.
- Philosophy – Customer-focused breakthrough improvement in processes
- Technique – Comprehensive set of statistical tools and methodologies
- Goal – Reduce variation, minimize defects, shorten the cycle time, improve yield, enhance customer satisfaction, and boost the bottom line
The Six Sigma methodology involves the following steps:
- Map core processes
- Identify key customers
- Align processes to critical customer requirements
- Install measurement and analysis systems to continuously improve processes
At the heart of Six Sigma is a systematic method for business improvement called DMAIC. The DMAIC model includes five phases:
- Define opportunities
- Measure performance
- Analyze opportunity
- Improve performance
- Control performance
Contrasting Six Sigma and TQM
The table below summarizes the key differences between Six Sigma and Total Quality Management (TQM):
| Six Sigma | Total Quality Management |
| Executive ownership | Self-directed work teams |
| Business strategy execution system | Quality initiative |
| Truly cross functional | Largely within a single function |
| Focused training with verifiable return | No mass training in statistics and quality |
| Business results oriented | Return on investment Quality oriented |
Basically, the following characteristics differentiate Six Sigma from quality initiatives of the past like TQM and continuous improvement:
- It is customer focused.
- It generates major quantifiable returns on investment. For example GE estimates that adoption of it has yielded 2 billion dollars in cost-savings in the last three years.
- It changes how management operates. It injects in the organization new ways of thinking, planning and executing to achieve the desired results. In many ways, Six Sigma helps to operationalize the notion of “working smarter, not harder”.
Six Sigma Toolkit
Given below is a list of key tools and techniques that are employed in implementing and executing Six Sigma projects. They have been grouped in five broad categories.
Tools for Generating Ideas and Organizing Information
- Brainstorming
- Affinity diagramming
- Multivoting
- Structure Tree
- High-level Process Map
- Flowchart
- Cause-And-Effect Diagrams
- Tools For Data-Gathering
Sampling
- Operational Definitions
- Voice of the Customer methods such as
- market research
- requirement analysis
- data warehouses
- data mining
- Check sheets and Spreadsheets
- Measurement Systems Analysis
Tools for Process And Data Analysis
- Process-Flow Analysis
- Value and Non-Value Added Analysis
- Charts and Graphs
- Pareto Chart
- Histogram
- Trend Chart
- Scatter Diagram
Tools for Process and Data Analysis
- Tests of statistical significance such as
- Chi-square
- T-tests
- Analysis of variance (ANOVA)
- Correlation and Regression
- Design of Experiments (DOE)
Tools for Implementation and Process Management
- Project Management techniques like
- Gantt charts
- PERT
- CPM
- Failure Mode and Effects Analysis
- Stakeholder Analysis
- Control Charts
- Force Field Diagram
- Process Documentation
- Balanced Scorecards and Process Dashboards
Usually companies are at 3 Sigma level which translates to 25-40% of annual revenue being taken by cost of quality. Thus, if a company can improve its quality by 1 sigma level, its net income will increase hugely, approximately 10 percent net income improvement.
Furthermore, when the level of process complexity increases (eg. output of one sub-process feeds the input of another sub-process), the rolled throughput yield of the process will decrease, then the final outgoing quality level will decline, and the cost of quality will increase. Project teams with well-defined projects improve the company’s profits.
The “Six Sigma” refers to six standard deviations (3.4 defects per a million occurrences). Five steps are
- Define Customer requirements, deliverables, and project goals via well-defined methods of customer communication
- Measure the existing process and its output to determine current quality performance (collect defect metrics)
- Analyze defect metrics and determine the vital few causes (the 20%)
- Improve the process by eliminating the root causes of defects
- Control the process to ensure that future work does not reintroduce the causes of defects
Statistical Six Sigma Definition
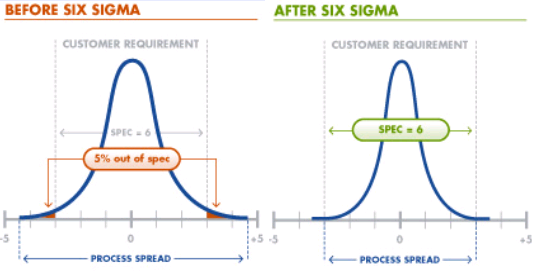
“Six Sigma” in many organizations simply means a measure of quality that strives for near perfection. But the statistical implications of a Six Sigma program go well beyond the qualitative eradication of customer-perceptible defects. It’s a methodology that is well rooted in mathematics and statistics. The objective of Six Sigma quality is to reduce process output variation so that on a long term basis, which is the customer’s aggregate experience with the companies process over time, this will result in no more than 3.4 defect parts per million (PPM) opportunities (or 3.4 defects per million opportunities – DPMO). For a process with only one specification limit (upper or lower), this results in six process standard deviations between the mean of the process and the customer’s specification limit (hence, Six Sigma). For a process with two specification limits (upper and lower), this translates to slightly more than six process standard deviations between the mean and each specification limit such that the total defect rate corresponds to equivalent of six process standard deviations.
Many processes are prone to being influenced by special and/or assignable causes that impact the overall performance of the process relative to the customer’s specification. That is, the overall performance of the process as customer views it might be 3.4 DPMO (corresponding to long term performance of 4.5 sigma). However, our process could indeed be capable of producing a near perfect output (Short Term capability – also known as process entitlement – of Six Sigma). The difference between the “best” a process can be, measured by short term process capability, and the customer’s aggregate experience (long term capability) is known as Shift depicted as Zshift or Sshift. For a “typical” process, the value of shift is 1.5; therefore, when one hears about Six Sigma, inherent in that statement is that the short term capability of the process is 6, the long term capability is 4.5 (3.4 DPMO – what the customer sees) with an assumed shift of 1.5. Typically, when reference is given using DPMO, it denotes the long term capability of the process, which is the customer’s experience. The role of the Six Sigma professional is to quantify the process performance (short term and long term capability) and based on the true process entitlement and process shift, establish the right strategy to reach the established performance objective.
As the process sigma value increases from zero to six, the variation of the process around the mean value decreases. With a high enough value of process sigma, the process approaches zero variation and is known as ‘zero defects.’
Mathematical Six Sigma
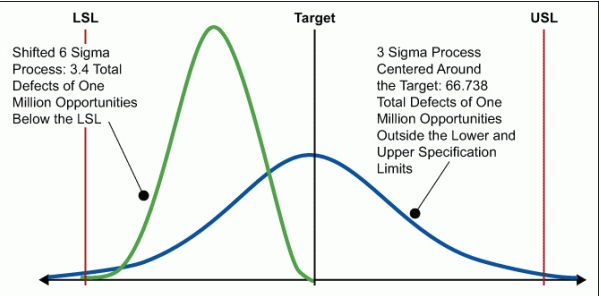
The term ‘Six Sigma’ is drawn from the statistical discipline ‘process capability studies’. Sigma, represented by the Greek alphabet ‘σ’, stands for standard deviation from the ‘mean’. ‘Six Sigma’ represents six standard deviations from the ‘mean.’ This implies that if a company produces 1,000,000 parts/units, and its processes are at Six Sigma level, less than 3.4 defects only will result. However, if the processes are at three sigma level, the company ends up with as many as 66,807 defects for every 1,000,000 parts/units produced.
The table below shows the number of defects observed for every 1,000,000 parts produced (also referred to as defects per million opportunities or DPMO).
| Sigma Level | Defects per million opportunities |
| Two Sigma | 308,507 DPMO |
| Three Sigma | 66,807 DPMO |
| Four Sigma | 6,210 DPMO |
| Five Sigma | 233 DPMO |
| Six Sigma | 3.4 DPMO |
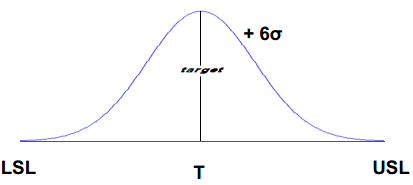
Process standard deviation (σ) should be so minimal that the process performance should be able to scale up to 12σ within the customer specified limits. So, no matter how widely the process deviates from the target, it must still deliver results that meet the customer requirements. Few terms used are
- USL – It is upper specification limit for a performance standard. Any deviation beyond this is a defect.
- LSL – It is lower specification limit for a performance standard. Any deviation below this is a defect.
- Target – Ideally, this will be the middle point between USL and LSL.
Six Sigma approach is to find out the root causes of the problem, symbolically represented by Y = F(X). Here, Y represents the problem that occurs due to cause (s) X.
| Y | x1, x2, x3, …., xn |
| Dependent | Independent |
| Customer related output | Input-process |
| Effect | Cause |
| Symptom | Problem |
| Monitor | Control |