When the capital asset pricing model (CAPM) is depicted graphically, it is called Security Market Line (SML) which is a straight line. It tells us the required return an investor should earn in the market place for any level of unsystematic (beta) risk. The X-axis of the security market line represents the market risk or beta and the Y-axis of SML represents expected market return in percentage at a point of time. Usually the rate of risk free investments is represented as a line parallel to X-axis and it is from here that the SML starts.
Example – The risk-free ratio is 4%, the beta value of market is 3% and expected return from market is 10%.
The expected return:
= 4 + 3(10 – 4) = 22%
SML will start from 4% at Y-axis and will pass through 22% when beta is 3.
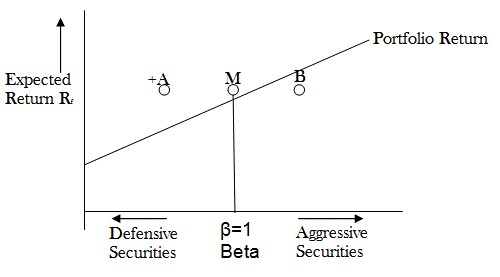
Investors can plot individual stock’s beta and expected return against SML. If the expected return from the stock is above SML the stock is considered undervalued and is predicted to offer good return for the risk taken. If the expected return falls below SML, the stock is considered overvalued and is predicted to offer lesser return for the risk taken.