Base Lining
Base lining refers to a metrics system in which the present performance of the organization is compared with historical metric or “baseline”. Baseline represents the organization’s performance in terms of schedule, effort involved and the defects.
The Base lining method can be used in the following scenarios
- Start of the project: For estimating the project effort and for planning reviews and testing.
- During the project: To determine whether a corrective measure is required.
- End of the project: To identify if the project was doing something good which should be institutionalized, and to identify whether the project was missing something which should be done on a similar project in future.
Usually there are three general steps in developing a baseline which are –
- Identifying the sources of baseline data
- Collecting the data
- Analyzing the data
PDCA
Edwards Deming in the 1950’s proposed that business processes should be analyzed and measured to identify sources of variations that cause products to deviate from customer requirements. He recommended that business processes be placed in a continuous feedback loop so that managers can identify and change the parts of the process that need improvements. As a teacher, Deming created a (rather oversimplified) diagram to illustrate this continuous process, commonly known as the PDCA cycle.
The plan–do–check–act cycle (Figure 1) is a four–step model for carrying out change. Just as a circle has no end, the PDCA cycle should be repeated again and again for continuous improvement.
When to Use Plan–Do–Check–Act
- As a model for continuous improvement.
- When starting a new improvement project.
- When developing a new or improved design of a process, product or service.
- When defining a repetitive work process.
- When planning data collection and analysis in order to verify and prioritize problems or root causes.
- When implementing any change.
Plan–Do–Check–Act Procedure
- Plan: Recognize an opportunity and plan a change.
- Do: Test the change. Carry out a small-scale study.
- Check: Review the test, analyze the results and identify what you’ve learned.
- Act: Take action based on what you learned in the study step: If the change did not work, go through the cycle again with a different plan. If you were successful, incorporate what you learned from the test into wider changes. Use what you learned to plan new improvements, beginning the cycle again.
A fundamental principle of the scientific method and PDCA is iteration—once a hypothesis is confirmed (or negated), executing the cycle again will extend the knowledge further. Repeating the PDCA cycle can bring us closer to the goal, usually a perfect operation and output.
Another fundamental function of PDCA is the “hygienic” separation of each phase, for if not properly separated measurements of effects due to various simultaneous actions (causes) risk becoming confounded.
PDCA (and other forms of scientific problem solving) is also known as a system for developing critical thinking. At Toyota this is also known as “Building people before building cars.” Toyota and other Lean companies propose that an engaged, problem-solving workforce using PDCA is better able to innovate and stay ahead of the competition through rigorous problem solving and the subsequent innovations. This also creates a culture of problem solvers using PDCA and creating a culture of critical thinkers.
In Six Sigma programs, the PDCA cycle is called “define, measure, analyze, improve, control” (DMAIC). The iterative nature of the cycle must be explicitly added to the DMAIC procedure.
Deming continually emphasized iterating towards an improved system, hence PDCA should be repeatedly implemented in spirals of increasing knowledge of the system that converge on the ultimate goal, each cycle closer than the previous. One can envision an open coil spring, with each loop being one cycle of the scientific method – PDCA, and each complete cycle indicating an increase in our knowledge of the system under study. This approach is based on the belief that our knowledge and skills are limited, but improving. Especially at the start of a project, key information may not be known; the PDCA—scientific method—provides feedback to justify our guesses (hypotheses) and increase our knowledge. Rather than enter “analysis paralysis” to get it perfect the first time, it is better to be approximately right than exactly wrong. With the improved knowledge, we may choose to refine or alter the goal (ideal state). Certainly, the PDCA approach can bring us closer to whatever goal we choose.
Rate of change, that is, rate of improvement, is a key competitive factor in today’s world. PDCA allows for major “jumps” in performance (“breakthroughs” often desired in a Western approach), as well as Kaizen (frequent small improvements). In the United States a PDCA approach is usually associated with a sizable project involving numerous people’s time, and thus managers want to see large “breakthrough” improvements to justify the effort expended. However, the scientific method and PDCA apply to all sorts of projects and improvement activities.
Six Sigma
It is the most widely used strategy for statistical quality assurance, uses data and statistical analysis to measure and improve a company’s operational performance, it Identifies and eliminates defects in manufacturing and service-related processes. It is basically a method that provides organizations tools to improve the capability of their business processes. This increase in performance and decrease in process variation lead to defect reduction and improvement in profits, employee morale, and quality of products or services.
The Six Sigma concept was developed at Motorola in the 1980s. Six Sigma can be viewed as a philosophy, a technique, or a goal.
- Philosophy – Customer-focused breakthrough improvement in processes
- Technique – Comprehensive set of statistical tools and methodologies
- Goal – Reduce variation, minimize defects, shorten the cycle time, improve yield, enhance customer satisfaction, and boost the bottom line
Six sigma is not just quality improvements but also providing better value to customers, investors and employees. Six Sigma is a business initiative or a way of doing business which improves quality and productivity, increases competitiveness and reduces cost. By controlling the amount of variation within the allowable upper and lower limits of a process, the frequency of out of control conditions reduces. Making six sigma as part of doing business reduces errors, identifies and corrects deviations in processes and impacts the success of the organization. Six Sigma is a process of asking questions that lead to tangible and quantifiable answers that ultimately produce profitable results. There are four groups of quality costs, which are
- External failure cost – warranty claims, service cost
- Internal failure cost – the costs of labor, material associated with scrapped parts and rework
- Cost of appraisal and inspection – these are materials for samples, test equipment, inspection labor cost, quality audits, etc..
- Cost related to improving poor quality – quality planning, process planning, process control, and training.
The Six Sigma approach aims to achieve the following three targets:
- Increased customer satisfaction
- Compressing the cycle time
- Reducing defects and eliminating waste resulting in substantial cost savings
The Six Sigma methodology involves the following steps:
- Map core processes
- Identify key customers
- Align processes to critical customer requirements
- Install measurement and analysis systems to continuously improve processes
At the heart of Six Sigma is a systematic method for business improvement called DMAIC. The DMAIC model includes five phases:
- Define opportunities
- Measure performance
- Analyze opportunity
- Improve performance
- Control performance
Contrasting Six Sigma and TQM
The table below summarizes the key differences between Six Sigma and Total Quality Management (TQM):
| Six Sigma | Total Quality Management |
| Executive ownership | Self-directed work teams |
| Business strategy execution system | Quality initiative |
| Truly cross functional | Largely within a single function |
| Focused training with verifiable return | No mass training in statistics and quality |
| Business results oriented | Return on investment Quality oriented |
Basically, the following characteristics differentiate Six Sigma from quality initiatives of the past like TQM and continuous improvement:
- Six Sigma is customer focused.
- Six Sigma generates major quantifiable returns on investment. For example GE estimates that adoption of Six Sigma has yielded 2 billion dollars in cost-savings in the last three years.
- Six Sigma changes how management operates. It injects in the organization new ways of thinking, planning and executing to achieve the desired results. In many ways, Six Sigma helps to operationalize the notion of “working smarter, not harder”.
Six Sigma Toolkit
Given below is a list of key tools and techniques that are employed in implementing and executing Six Sigma projects. They have been grouped in five broad categories.
Tools for Generating Ideas and Organizing Information
- Brainstorming
- Affinity diagramming
- Multivoting
- Structure Tree
- High-level Process Map
- Flowchart
- Cause-And-Effect Diagrams
- Tools For Data-Gathering
Sampling
- Operational Definitions
- Voice of the Customer methods such as
- market research
- requirement analysis
- data warehouses
- data mining
- Check sheets and Spreadsheets
- Measurement Systems Analysis
Tools for Process And Data Analysis
- Process-Flow Analysis
- Value and Non-Value Added Analysis
- Charts and Graphs
- Pareto Chart
- Histogram
- Trend Chart
- Scatter Diagram
Tools for Process and Data Analysis
- Tests of statistical significance such as
- Chi-square
- T-tests
- Analysis of variance (ANOVA)
- Correlation and Regression
- Design of Experiments (DOE)
Tools for Implementation and Process Management
- Project Management techniques like
- Gantt charts
- PERT
- CPM
- Failure Mode and Effects Analysis
- Stakeholder Analysis
- Control Charts
- Force Field Diagram
- Process Documentation
- Balanced Scorecards and Process Dashboards
Usually companies are at 3 Sigma level which translates to 25-40% of annual revenue being taken by cost of quality. Thus, if a company can improve its quality by 1 sigma level, its net income will increase hugely, approximately 10 percent net income improvement.
Furthermore, when the level of process complexity increases (eg. output of one sub-process feeds the input of another sub-process), the rolled throughput yield of the process will decrease, then the final outgoing quality level will decline, and the cost of quality will increase. Project teams with well-defined projects improve the company’s profits.
The “Six Sigma” refers to six standard deviations (3.4 defects per a million occurrences). Five steps of six sigma are
- Define Customer requirements, deliverables, and project goals via well-defined methods of customer communication
- Measure the existing process and its output to determine current quality performance (collect defect metrics)
- Analyze defect metrics and determine the vital few causes (the 20%)
- Improve the process by eliminating the root causes of defects
- Control the process to ensure that future work does not reintroduce the causes of defects
Tools for applying Six Sigma are
- Run Chart: Can be used to identify when business processes involved in software development are not behaving according to specifications
- Pareto Analysis: Can be used to find 20% of the causes, resulting in 80% of the quality problems
- Checksheet: Can be used to keep track of defects or used to make sure people collect data in a correct manner
- Histogram: Can be used to identify the frequency of quality defect occurrence and display quality performance
- Ishikawa Diagram: Can be used to systematically track backwards to find a possible cause of a quality problem (or effect)
Statistical Six Sigma Definition
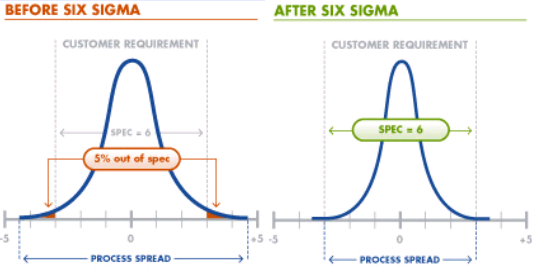
“Six Sigma” in many organizations simply means a measure of quality that strives for near perfection. But the statistical implications of a Six Sigma program go well beyond the qualitative eradication of customer-perceptible defects. It’s a methodology that is well rooted in mathematics and statistics. The objective of Six Sigma quality is to reduce process output variation so that on a long term basis, which is the customer’s aggregate experience with the companies process over time, this will result in no more than 3.4 defect parts per million (PPM) opportunities (or 3.4 defects per million opportunities – DPMO). For a process with only one specification limit (upper or lower), this results in six process standard deviations between the mean of the process and the customer’s specification limit (hence, Six Sigma). For a process with two specification limits (upper and lower), this translates to slightly more than six process standard deviations between the mean and each specification limit such that the total defect rate corresponds to equivalent of six process standard deviations.
Many processes are prone to being influenced by special and/or assignable causes that impact the overall performance of the process relative to the customer’s specification. That is, the overall performance of the process as customer views it might be 3.4 DPMO (corresponding to long term performance of 4.5 sigma). However, our process could indeed be capable of producing a near perfect output (Short Term capability – also known as process entitlement – of Six Sigma). The difference between the “best” a process can be, measured by short term process capability, and the customer’s aggregate experience (long term capability) is known as Shift depicted as Zshift or Sshift. For a “typical” process, the value of shift is 1.5; therefore, when one hears about Six Sigma, inherent in that statement is that the short term capability of the process is 6, the long term capability is 4.5 (3.4 DPMO – what the customer sees) with an assumed shift of 1.5. Typically, when reference is given using DPMO, it denotes the long term capability of the process, which is the customer’s experience. The role of the Six Sigma professional is to quantify the process performance (short term and long term capability) and based on the true process entitlement and process shift, establish the right strategy to reach the established performance objective.
As the process sigma value increases from zero to six, the variation of the process around the mean value decreases. With a high enough value of process sigma, the process approaches zero variation and is known as ‘zero defects.’
Mathematical Six Sigma
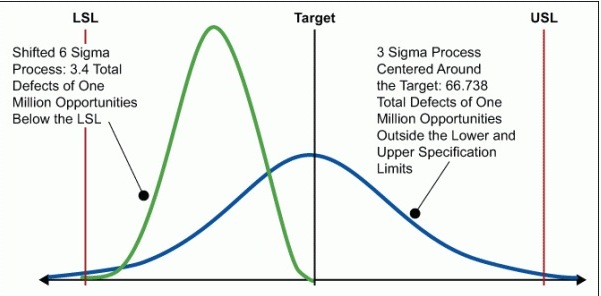
The term ‘Six Sigma’ is drawn from the statistical discipline ‘process capability studies’. Sigma, represented by the Greek alphabet ‘σ’, stands for standard deviation from the ‘mean’. ‘Six Sigma’ represents six standard deviations from the ‘mean.’ This implies that if a company produces 1,000,000 parts/units, and its processes are at Six Sigma level, less than 3.4 defects only will result. However, if the processes are at three sigma level, the company ends up with as many as 66,807 defects for every 1,000,000 parts/units produced.
The table below shows the number of defects observed for every 1,000,000 parts produced (also referred to as defects per million opportunities or DPMO).
| Sigma Level | Defects per million opportunities |
| Two Sigma | 308,507 DPMO |
| Three Sigma | 66,807 DPMO |
| Four Sigma | 6,210 DPMO |
| Five Sigma | 233 DPMO |
| Six Sigma | 3.4 DPMO |
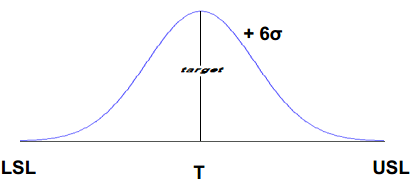
Process standard deviation (σ) should be so minimal that the process performance should be able to scale up to 12σ within the customer specified limits. So, no matter how widely the process deviates from the target, it must still deliver results that meet the customer requirements. Few terms used are
- USL – It is upper specification limit for a performance standard. Any deviation beyond this is a defect.
- LSL – It is lower specification limit for a performance standard. Any deviation below this is a defect.
- Target – Ideally, this will be the middle point between USL and LSL.
Six Sigma approach is to find out the root causes of the problem, symbolically represented by Y = F(X). Here, Y represents the problem that occurs due to cause (s) X.
| Y | x1, x2, x3, …., xn |
| Dependent | Independent |
| Customer related output | Input-process |
| Effect | Cause |
| Symptom | Problem |
| Monitor | Control |
Benefits of Six Sigma
- Continuous defect reduction in products and services
- Enhanced customer satisfaction
- Performance dashboards and metrics
- Process sustenance
- Project based improvement, with visible milestones
- Sustainable competitive edge
- Helpful in making right decisions
