It very crucial for the management to practice control. The control management system is important under project management to manage the project with limited resources and means. The implementation of control is necessary to not allow any misuse of resources and means.
Project control includes the following,
- Inspection of the performance
- Inspect whether or not the direction given at different times have been implemented
- Inspect whether or not the performances is going according to the policy as determined
- Inspect whether or not all the necessary works are being done in the project directing towards the objective
- Inspect whether or not the project is being operated according to the policies and principle adopted
- Inspect whether or not the directions given have been properly implemented
Aim of the project control system
- To evaluate progress report of the project.
- To check whether or not the project is going on according to the objective.
- To check whether the project is being operated according to the objective.
- To determine which works are being completed and which have remained to be completed.
- To take corrective steps are necessary to achieve the objective.
Work breakdown structure (WBS)
Work Break Down Structure can be defined as a detailed functional plan of all the tasks to be performed systematically in a set order under a project considering the factors of time and cost. WBS is considered as an important tools to control the project. This WBS technique is adopted at the initial/primary stage of a project. According to the WBS technique, the tasks performed during the project are divided in different stages so as to bring clarity of the roles and responsibility each individual involved in the project as well as the techniques to be used to perform the task.
The primary objective of WBS is to display that the work to be done should be in a systematic order. WBS is also referred as project working schedule where the project activities are to be controlled according to the prescribed schedule. The project works done needs to be controlled and if any change is required, then the work break down structure can be changed. WBS remains as point of reference to measure the performance and maintain the performance of project.
Network Analysis
- PERT: Project evaluation and review technique (PERT) is an important network analysis technique used for evaluation and control of the This technique is more useful for the research and development related projects. PERT is a feasibility study oriented technique suitable for new technology, uncertain time and risky projects.
- Critical path method (CPM): This technique was first used in DuPont company (USA) to manage cost and time schedule. This method is one of the most important tools used for evaluating and controlling the This is used in less risky and fixed period time projects.
Line of Balance (LOB)
LOB is mainly used in project related to production. Primarily this technique is used in the projects where there are many producers of the same types of goods. This method says that the best one among all should operate according to the production level and method of its own. Only then the project becomes successful and competitive. The sole objective of this technique is to promote the quality of production. This technique is used in cases to maintain quality of products making it competitive with other companies products. Therefore LOB is also referred as equal standard technique which tries to maintain quality and also promote it.
Gantt Chart
Gantt chart is a graphical chart, that depicts the relationships between the project tasks, considering the time constraints. The horizontal axis of a Gantt chart displays the units of time (in days, weeks, months, etc.) and the vertical axis displays the activities to be completed. Here, the Bars show the estimated start time and duration of different activities. Primarily, a Gantt chart shows what has to be done i.e., the activities to performed and when the activity is to be performed.
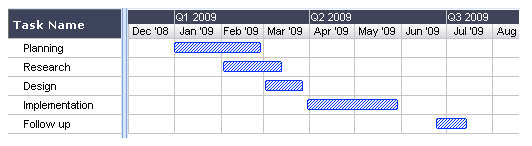
Gantt chart is a very common tool used throughout a project for various purposes. It is used for tracking progress and for controlling performance.
In order to interpret a Gantt chart, one must focus on the four critical areas – resources, durations, milestones and slack time. Diamonds usually indicate critical milestones in the project, squares indicate the beginning and end of the critical path and are linked to the milestones. Slack time on the chart is indicated with a horizontal line that extends from the actual end of a task to its allocated end time.
Earned value management (EVM)
Earned value management (EVM), is a project management technique used for measuring project performance and progress in an objective manner. EVM has the ability to combine measurements of the project management triangle of scope, time and costs. In a single integrated system, EVM is able to provide accurate forecasts of project performance problems.
The EVM implementations for large or complex projects include many features, such as indicators and forecasts of cost performance and schedule performance. However, the most basic requirement of an EVM system is that it quantifies progress using PV and EV.
EVA can be used as a management tool as an early warning system to detect deficient or endangered progress. EVM measures progress against a baseline. It involves calculating three key values for each activity in the Work Break Down Structure,
- Planned Value (PV), It is that portion of the approved cost estimate planned to be spent on the given activity during a given period.
- The Actual Cost (AC) – It is the total of the costs incurred in accomplishing work on the activity in a given period.
- The Earned Value (EV)- — It is the value of the work actually completed.
Illustration: Lets assume that a Project X has been approved for a duration of 1 year and with the budget of A. It was also planned that the project spends 50% of the approved budget in the first 6 months. If now 6 months after the start of the project a Project Manager would report that he has spent 50% of the budget, one can initially think, that the project is perfectly on plan. However, in reality the provided information is not sufficient to come to such a conclusion. The project can spend 50% of the budget, whilst finishing only 25% of the work, which would mean the project is not doing well; or the project can spend 50% of the budget, whilst completing 75% of the work, which would mean that project is doing better than planned. In which case the EVM technique useful and addresses such and similar issues.
Project Tracking
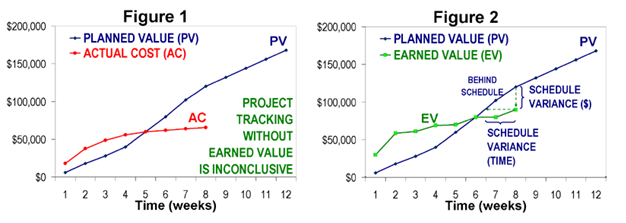
Lets take up an illustration does not include earned value performance management. Consider a project that has been planned in detail, including a time-phased spend plan for all elements of work. Figure 1, below displays the cumulative budget (cost) for this project (PV) as a function of time. It also shows the cumulative actual cost of the project (AC) through week 8. It might appear that this project was over budget through week 4 and then under budget from week 6 through week 8. However, what is not shown in the chart is the amount of work accomplished during the project. If the project was actually completed at week 8, then the project would actually be well under budget and well ahead of schedule. If, on the other hand, the project is only 10% complete at week 8, the project is significantly over budget and behind schedule. Therefore EVM technique is used to measure technical performance objectively and quantitatively.
Project tracking with EVM
Now we consider the same project, such that in this case the project plan includes pre-defined methods of quantifying the accomplishment of work. Such that at the end of each week, the project manager identifies every detailed element of work that has been completed, and sums the EV for each of these completed elements. Earned value can be accumulated monthly, weekly, or as progress is made.
Earned value (EV)
In the above case, Figure 2 displays the EV curve (in green) along with the PV curve from Figure 1. Here, the chart indicates that the technical performance (which is the progress) started more rapidly than planned, but slowed significantly and fell behind schedule at week 7 and 8. This chart illustrates the schedule performance aspect of EVM. It is complementary to critical path or critical chain schedule management.
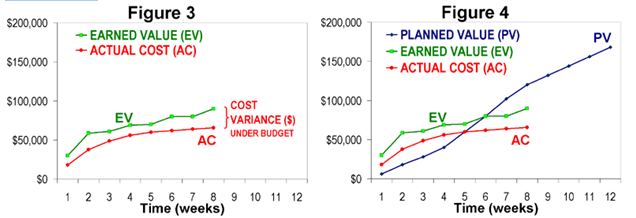
Let us now consider, Figure 3 which shows the same EV curve (in green) with the actual cost data from Figure 1 (in red). Here in figure 3 we can seen that the project was actually under budget, relative to the amount of work accomplished, since the start of the project. This is a far better conclusion than can be derived from Figure 1.
Now lets take up Figure 4 which shows all three curves together – This depicts a a typical EVM line chart. One of the best way to read these three-line charts is to first identify the EV curve, then compare the EV curve to PV (to look for schedule performance) and AC (to look for cost performance). In the above illustration we can say that a true understanding of cost performance and schedule performance relies first on measuring technical performance objectively, which is the foundational principle of EVM.
Implementation
It has been seen that historically only the largest and most complex projects have enjoyed the benefits of EVM. Yet, lightweight implementations of EVM is achievable by those who hold basic spreadsheet skills. One of the best way to learn EVM skills is to hold skills for spreadsheet implementations.
Steps involved in the process of implementation
- The first step involved in the process of implementation is to define the work which is typically done in a hierarchical arrangement called a work breakdown structure (WBS) even though the easiest projects may use a simple list of tasks. It is therefore important that the WBS or list should be comprehensive in either case. Also it is essential that the elements are mutually exclusive, so as to ensure that the work is easily categorized in one and only one element of work. The most detailed elements of a WBS hierarchy are called activities or tasks.
- The second step in the process of implementation is to assign a value, called planned value (PV), to each of the activities. For the bigger projects, PV is almost always an allocation of the total project budget, and might be in units of currency (like, dollars or euros) or in labor hours, or both. However, in simpler projects, each activity may be assigned a weighted “point value” which might not be a budget number. Here, assigning weighted values and achieving consensus on all PV quantities tends to yield an important benefit of EVM, because it exposes misunderstandings and miscommunications about the scope of the project, and resolving these differences should always occur as early as possible.
- The third step in the process of implementation is to define “earning rules” for each activity. One of the simplest method is to apply just one earning rule, such as the 0/100 rule, to all the defined Under the 0/100 rule, no credit is earned for an element of work until it is finished. A related rule is also known as the 50/50 rule, which means 50% credit is earned when an element of work is started, and the remaining 50% is earned upon completion. Some of the other fixed earning rules are 25/75 rule or 20/80 rule that are used for gaining favor, because they assign more weight to finishing work than for starting it, it thereby motivates the project team to identify when an element of work is started, which can also improve the awareness of work-in-progress. All the defined simple earning rules work well for small or simple projects as usually each activity tends to be of fairly short duration.
- The fourth and the final step in the process of EVM implementation is to execute the project according to the plan and measure its So when activities are started or finished, EV is accumulated according to the earning rule. This process is typically done at regular intervals in fact can also be accumulated in near real-time, when work elements are started/completed. Therefore waiting to update EV only once per month only detaches from the benefit of using EVM, which involves creating a technical performance scoreboard for the entire project team.
