Profitability ratios can be related to Sales in respect of Gross Profit Margin, Net Profit Margin and Expenses.
Gross Profit Margin to Sales ratio
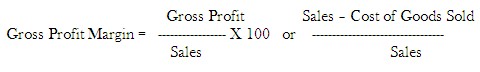
High G/P ratio is a sign of good management and low G/P ratio is a cause of worry to unless there is improvement in managing.
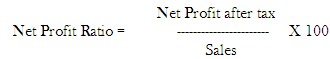
Net Profit Margin to Sales ratio
Net Profit Margin ratio is calculated as below:
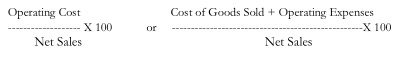
Expenses Ratios
These ratios establish relationship between various expenses and sales:
Cost of Goods Sold Ratio = Cost of Goods Sold X 100 / Net Sales
Administrative Expenses Ratio
Administrative Expenses x 100/ Net Sales
Selling & Distribution Expenses Ratio
Selling & Distribution Expenses X 100 /Net Sales
Operating Ratios
Operating Cost
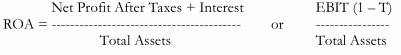
Profitability in relation to Investments
These ratios relate Profit to Investments. Return On Investments (ROI) is related to three categories of Assets, Shareholders’ Equity / Funds and Capital Employed
Return on Assets
Return on Capital Employed (ROCE)
Net Profit after taxes
ROCE = —————————————————
Capital Employed
(Non Current Liabilities + Owners’ Equity)
Return to Shareholders
Return on Total Shareholders’ Equity = Net Profit after Tax / Shareholders’ Funds
Shareholders’ Funds = Equity Share Capital + Preference Share Capital + Reserves & Surplus – Accumulated losses, if any)
Return on Equity Capital (ROE)
ROE = Profit after tax – Preference Dividend / Shareholders’ Equity or Net Worth
Earnings Per Share (EPS)
EPS is the amount equity holders can get on every share held
EPS = Net Profit available to equity holders (Net Profit after tax – Preference Dividend) / Number of Equity Shares
Dividend Per Share (DPS)
The earnings distributed to the shareholders as cash dividends
DPS = Earnings paid to shareholders / Number of Equity Shares
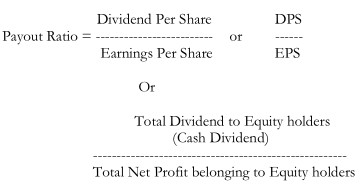
Dividend Payout Ratio
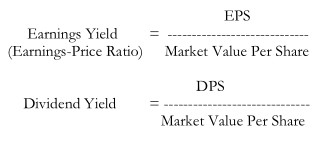
Earnings Yield and Dividend Yield
The yield is expressed in terms of the market value per share
Price-Earnings (P/E) Ratio
P/E Ratio assesses a firm/s performance as expected by the investors. It is the reciprocal of Earnings Yield or Earnings
Price Ratio P/E Ratio = Market Price Per Share / Earnings Per Share
Market to Book Value Ratio
Market Price Per Share / Book Value Per Share
