Probability is a measure of the likeliness that an event will occur. Probability is used to quantify an attitude of mind towards some proposition of whose truth we are not certain. A distribution is the amount of variation in the outputs of a process, expressed by shape (symmetry, skewness and kurtosis), average and standard deviation.
It is a mathematical formula relating the values of a characteristic or attribute with their probability of occurrence in the population. It depicts the possible events and the associated probability for each of these events to occur. Probability distribution is divided as
- Discrete data describe a finite set of possible occurrences for the data like rolling a dice with the random variable can take value from 1, 2, 3, 4, 5 or 6. The most used discrete probability distributions are the binomial, the Poisson, the geometric, and the hypergeometric distribution.
- Continuous data describes a continuum of possible occurrences that is unbroken as, the distribution of body weight is a random variable with infinite number of possible data points.
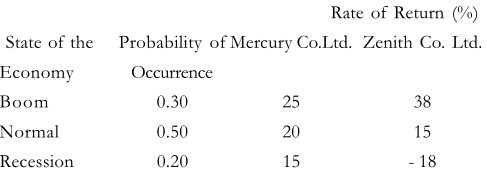
An investment in a stock may result in various possible values. Consider two equity stocks, Mercury Company Ltd and Zenith Company Limited. Mercury Company Ltd may provide a return of 15%, 20% or 25% with certain probabilities associated with them, based on the state of the economy. The stock Zenith Company Limited, being more volatile, earn a return of – 18%,15% or 38% with the same probabilities, based on the state of the economy.
The probability of an event represents the likelihood of its occurrence. Suppose you say that there is a 4 to 1 chance that the market price of a stock A will rise during the next fortnight. This implies that there is an 80% chance that the price of stock A will increase and a 20 % chance that it will not increase during the next fortnight. Your judgment can be represented in the form of probability distribution as follows:
Outcome Probability
Stock price will rise 0.80
Stock price will not rise 0.20
When you define the probability distribution of rate of return (or for that matter any other variable) remember that
- The possible outcomes must be mutually exclusive and collectively exhaustive.
- The probability assigned to an outcome may vary between 0 and 1. (An impossible event is assigned a probability of 0, a certain event a probability of 1, and an uncertain event a probability somewhere between 0 and 1.)
- The sum of the probabilities assigned to various possible outcomes is 1.
Probability Distributions of the Rate of Return on Mercury Company Limited Stocks and Zenith Company Limited Stock
Based on the probability distribution of the rate of return, you can compute two key parameters, the expected rate of return and the standard deviation of rate of return.
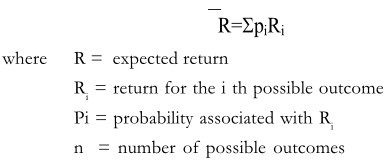
From the above eqn. it is clear that R is the weighted average of\ possible outcomes-each out-come is weighted by the probability associated with it. The expected rate of return on Mercury stock is:
Rm= (0.30) (25%) + (0.50) (20%) + (0.20) (15%) = 20.5%
Similarly, the expected rate of return on Zenith stock is:
Rz = (0.30) (40%) + (0.50) (10%) + (0.20) (- 20%) = 13.0%
