Impact of Demand and Lead Time Uncertainties
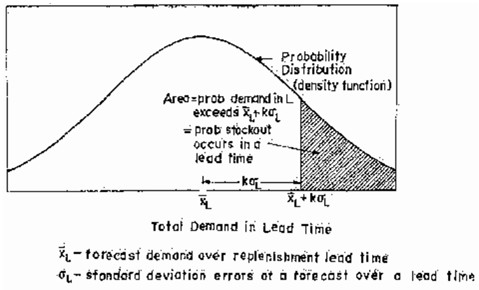
In the inventory models described in previous section we assumed that there was no uncertainty associated with the demand and replenishment-lead times. However, in reality there is always some uncertainty associated with the demand pattern and lead times. It can be shown that as the uncertainty (variability) of demand and lead times increases, extra stock in the form of safety stock (buffer stock) is required to account for these uncertainties. In the deterministic system, reorder point is very easy to determine as it is the demand during the lead time. For example, if the demand is uniform at a rate of 100 units / month and lead time is 3 months, then in the deterministic system the reorder point is 300 units. However, if there is variability of demand and times, an extra buffer stock will be added to the expected demand during the lead tithes, to obtain the reorder point. Furthermore, despite higher reorder point due to extra safety stock to provide cushion for system variability, there will still be a probability of stock out. Figure X shows the mechanics of occurrence of shortage in a probabilistic inventory system. If XL is the average demand during the lead time and Figure L is the standard distribution of lead time demand and if reorder point is set of XL+K L for normally distributed demand, then the shaded area of Figure X gives the probability of stock out during the lead time. This value can be obtained from standard normal tables for various values of K.
Determination of Reorder Point
As stated earlier, the Reorder Point (R) in the probabilistic lot size inventory system is given by:
R = Expected demand during lead time + Buffer (safety stock)
= XL + K. L
For obtaining XL and L from the distribution of demand and lead times a lead time demand distribution (LT.DD) such as shown in Figure X can be obtained. The following expressions characterize the LTDD:
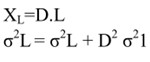
Where D = Expected demand rate
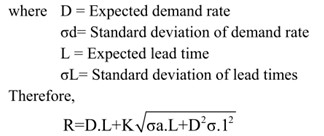
This expression quantitatively incorporates the effect of demand and lead time variability on R and buffer stock. It can be seen that as ad, a1 increase, signifying higher demand and lead time variability, the Reorder point and buffer stock increases. If lead time is constant at L, then 1 = 0 and R = D.L. + K. d √L Similarly if the demand is constant, ad = 0, then
R=D.L+K. 1.D
If both demand and lead times are constant, d = 0, 1 = 0, then R = D.L. (Demand during lead time)
Buffer stock = 0
Safety Stock and Service Levels
In the determination of safety stock, the factor K obtainable from normal distribution tables for normally distributed lead time demand depends upon the risk of shortage we are prepared to accept. Higher value of K means less risk of shortage (or high service level) and vice-versa. For example if K = 1, then risk of shortage is 15.87 % or service level is (100-15.87 = 84.13%). At K = 2, the risk of shortage is 2.28% and at K = 3, the risk is 0.13 % only. Obviously, at K = 0, buffer stock is zero but risk of shortage is 50%. Thus we can choose K (hence buffer stock) for a prescribed risk of shortage during a lead time.
