It is an estimate of an interval in which future observations will fall, with a certain probability, given what has already been observed.
A prediction interval bears the same relationship to a future observation that a frequent confidence interval bears to an unobservable population parameter: prediction intervals predict the distribution of individual future points, whereas confidence intervals and credible intervals of parameters predict the distribution of estimates of the true population mean or other quantity of interest that cannot be observed. Prediction intervals are also present in forecasts. It is difficult to estimate the prediction intervals of forecasts that have contrary series.
Prediction Intervals represent the uncertainty of predicting the value of a single future observation or a fixed number of multiple future observations from a population based on the distribution or scatter of a number of previous observations. Similar to the confidence interval, prediction intervals calculated from a single sample should not be interpreted to mean that a specified percentage of future observations will always be contained within the interval; rather a prediction interval should be interpreted to mean that when calculated for a number of successive samples from the same population, a prediction interval will contain a future observation a specified percentage of the time.
For example: if we collect a sample of observations and calculate a 95% prediction interval based on that sample, there is a 95% probability that a future observation will be contained within the prediction interval. Conversely, there is also a 5% probability that the next observation will not be contained within the interval. If we collect 20 samples and calculate a prediction interval for each one, we can expect that 19 of the intervals calculated will contain a single future observation while 1 of the intervals calculated will not contain a single future observation. This interpretation of the prediction interval is depicted graphically in figure.
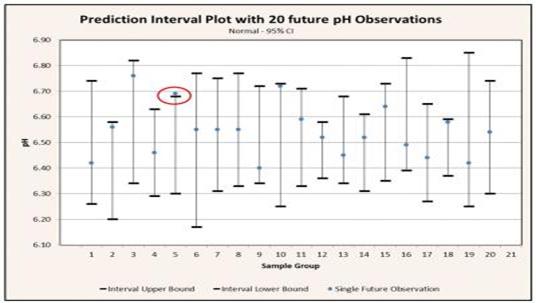
Plot of upper and lower prediction interval bounds for 20 samples each consisting of 10 pH measurements drawn from the same population. The plot also includes 20 individual future observations. Notice that 1 out of the 20 single future pH readings (circled in red) is outside of the associated prediction interval region. This is in alignment with the 5% of intervals not expected to contain a single future observation for a confidence level of 95%.
Prediction intervals are most commonly used in regression statistics, but may also be used with normally distributed data. Calculation of a prediction interval for normally distributed data is much simpler than that required for regressed data, so we will start there.
Prediction Interval for Normal Data
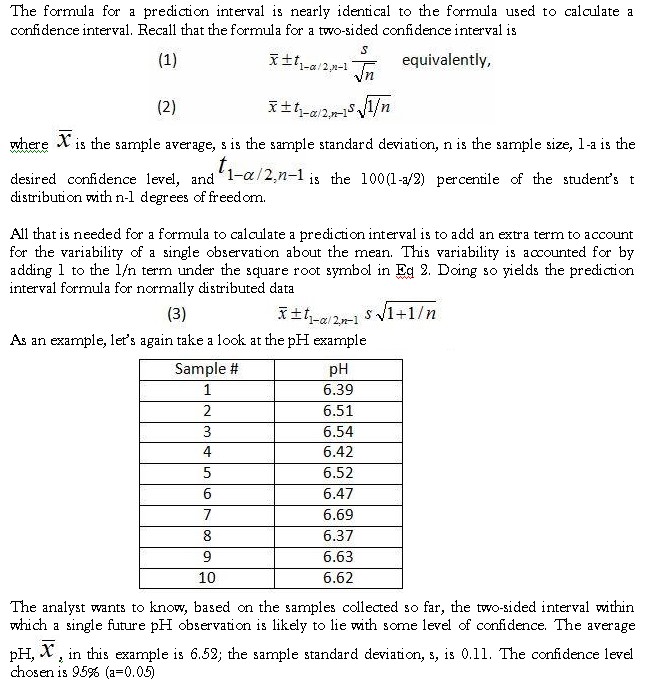
Unlike confidence intervals that are only concerned with the center of the population distribution, prediction intervals take into account the tails of the distribution as well as the center. As a result, prediction intervals have greater sensitivity to the assumption of normality than do confidence intervals and thus the assumption of normality should be tested prior to calculating a prediction interval. The normality assumption can be tested graphically and quantitatively using appropriate statistical software such as Minitab. For this example the analyst enters the data into Minitab and a normal probability plot is generated.
Prediction intervals provide a means for quantifying the uncertainty of a single future observation from a population provided the underlying distribution is normal. Prediction intervals can be created for normally distributed data, but are best suited for quantifying the uncertainty associated with a predicted response in linear regression statistics. Because prediction intervals are concerned with the individual observations in a population as well as the parameter estimates, prediction intervals will necessarily be wider than a confidence interval calculated for the same data set. For the same reason, prediction intervals are also more susceptible to the assumption of normality than are confidence intervals.
