
An oscillator is a leading technical indicator which fluctuates above and below a center line. They normally have upper and lower bands that indicate overbought and oversold conditions in the market. The MACD is also an oscillator but it is an exception. Other popular oscillators are discussed in detail.
Relative Strength Index
The RSI is an indicator representing the momentum in a particular stock along with when it is reaching extreme levels to the upside (overbought) or downside (oversold) and is therefore due for a reversal.
Before going further, it is important to understand momentum and its importance to oscillators. Many leading indicators come in the form of momentum oscillators. Momentum measures the rate-of-change of a security’s price. As the price of a security rises, price momentum increases.
The faster the security rises, the larger the increase in momentum. Once this rise begins to slow, momentum will also slow. As a security begins to trade flat, momentum starts to decline from previous high levels. However, declining momentum in the face of sideways trading is not always a bearish signal. It simply means that momentum is returning to a more median level. The RSI indicator is based on the momentum of a stock or any other financial security being traded.
The RSI indicator is calculated through a formula which compares the size of recent gains for a particular security to the size of recent losses. The results are then plotted as a line which fluctuates between 0 and 100. Bands are placed at- 70 which is considered an extreme level to the upside, and 30 which is considered an extreme level to the downside.
Example of the RSI Indicator

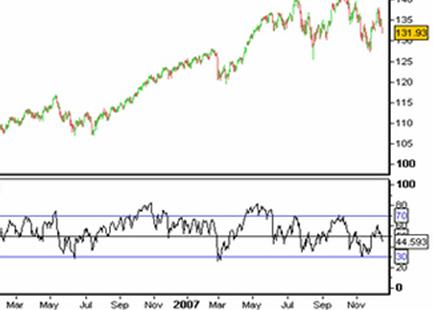
The Relative Strength Index serves traders in 3 ways.
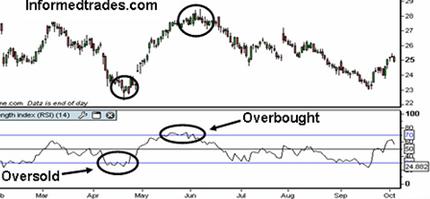
- The RSI is used to identify and potentially trade overbought and oversold areas in the market. Because of the way the RSI is constructed, a reading of 100 would indicate zero losses in the dataset, and a reading of zero would indicate zero gains, both of which would be a very rare occurrence. The level of 70 is used to identify overbought conditions and level of 30 is used to identify oversold conditions. When the RSI line trades above the 70 line this is seen as an indication that the market is becoming overextended to the upside. Conversely when the market trades below the 30 line this is seen as a sign that the market is becoming over extended to the downside. For trading purposes, people go long when the RSI is below 30 and go short when it is above 70. As with all indicators, it is best used along with other supporting indicators and patterns.
Example of RSI Indicator Showing Overbought and Oversold

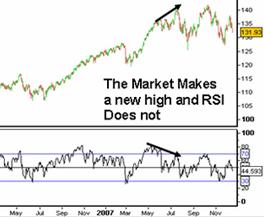
- Noticing a divergence between the RSI and the financial instrument price movement is another way of using RSI. When these divergences occur after overbought or oversold conditions in the market, they act as a sign that a move is losing momentum and there may be reversals in the market. Divergences provide a potential opportunity to trade a reversal or to enter in the direction of a trend on a pullback.
Example of RSI Indicator Divergence

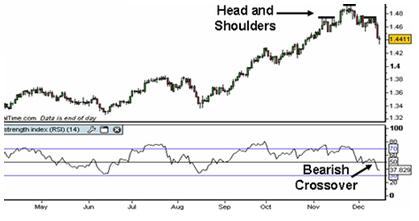
- The RSI identifies bullish and bearish changes in the market through the RSI line crossovers above or below the center line. The crossover is used as confirmation for trades based on other methods.
Example of the RSI Indicator Centerline Crossover

Stochastic Oscillator
There are 3 different types of stochastic oscillators: the fast, slow, and full stochastic. The basic premise of the stochastic is that prices tend to close in the upper end of their trading range when the financial security is in an uptrend and in the lower end of their trading range when the stock/market is in a downtrend. When prices close in the upper end of their range in an uptrend this is a sign that the momentum of the trend is strong and vice versa for a downtrend.
The Stochastic Oscillator contains two lines which are plotted below the price chart and are known as the %K and %D lines. The Stochastic is also a banded oscillator. The %K and %D lines fluctuate between zero and 100, and it has lines plotted at 20 and 80 which represent the high and low ends of the range.
Example of a Stochastic Oscillator

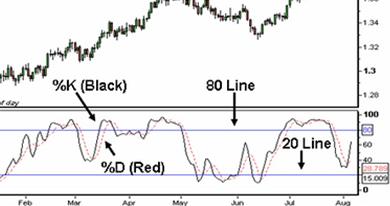
The %K line is a representation of where the market has closed for each period in relation to the trading range for the 14 periods used in the indicator. In simple terms it is a measure of momentum in the market.
The %D line is a 5 period simple moving average of the %K line. One can change the inputs for the indicator and use, for example, a 3 period moving average of the %K line to get faster signals.
Like the RSI, the stochastic oscillator is also used by traders in 3 ways.
- Traders use the stochastic oscillator is to identify overbought and oversold levels in the market. When the lines that comprise the indicator are above 80, it represents a market that is potentially overbought and when they are below 20, it shows a market that is potentially oversold. It is a recommendation to wait for the %K line to trade back below or above the 80 or 20 lines as this gives a better signal that the momentum in the market is reversing.
Example of Overbought and Oversold Trading Signals

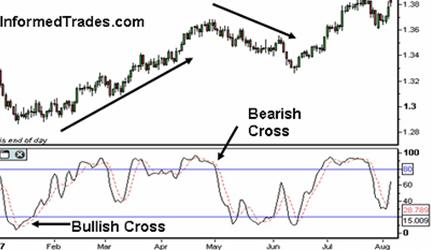
- When the faster %K line crosses the slower %D line this is a sign that the market may be heading up and when the %K line crosses below the %D line this is a sign that the market may be heading down. This strategy results in many false signals and hence traders use this strategy only with other indicators for confirmation.
Example of the Stochastic Crossover

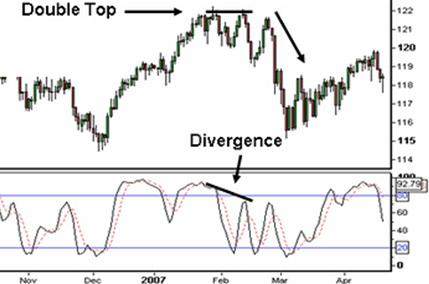
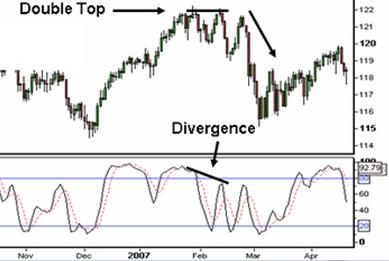
- The third way use of this indicator is divergences where the Stochastic trends in the opposite direction of price. As with the RSI this is an indication that the momentum in the market is waning and a reversal may be in the making. For further confirmation traders wait for the crossovers below the 80 or above the 20 line before entering a trade on divergence.
Example of Divergence

As the RSI and Stochastic are similar in nature many traders will use them in conjunction with one another to confirm signals.
Apply for Technical Analysis Certification Now!!
http://www.vskills.in/certification/Certified-Technical-Analyst