Insert Tables, Charts, and Diagrams
Table Creation
To organize its information, a table is made of columns and rows. This also means that these would be the first two pieces of information you must provide to initiate a table. As stated already, the columns are the vertical arrangements while the rows are the horizontal records. To specify these numbers, if you double-click the Double Click To Add Table button on a Table slide, the Insert Table Table dialog box would appear:
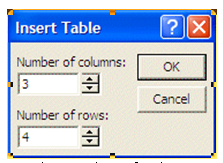
This allows you to specify the starting number of columns and the starting number of slides. Thedefault values are set to 2 each. To change these numbers, you can either click the corresponding text box, delete the value and type the new one, or you can click the up and down arrows of the spin button. After specify the values, you can click OK.
This allows you to specify the starting number of columns and the starting number of slides. Thedefault values are set to 2 each. To change these numbers, you can either click the corresponding text box, delete the value and type the new one, or you can click the up and down arrows of the spin button. After specify the values, you can click OK.
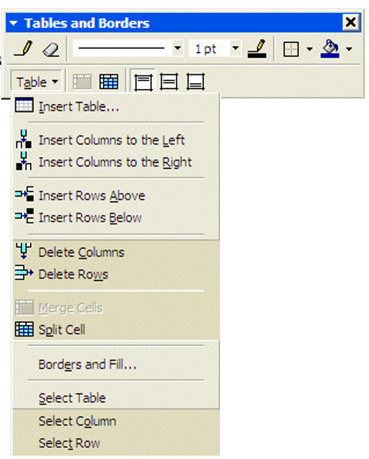
If you find out that you need more columns or more rows, you can use the Draw Table tool of the Tables and Borders toolbar. It allows you to draw horizontal or vertical lines. Another technique you can use to add columns and/or rows consists of clicking the Table button on the Tables and Borders toolbar and selecting an option on its menu:
Create an organization chart
You can insert an organization chart into a document to illustrate an organization’s structure or to depict other hierarchical relationships—for example, the families, genera, and species of a particular order of biological organisms. To add an organization chart, perform the following steps:
- On the Insert menu, point to Picture, and then click Organization Chart.
Office will then insert an organization chart with a single top-level box and three subordinate boxes, and theOrganization Chart toolbar displays. (This toolbar appears automatically whenever you select an organization chart.)
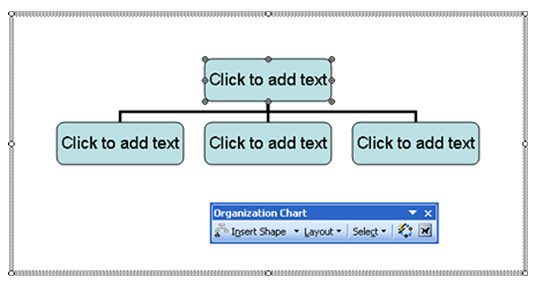
- To add text to a box, click in it and type the desired text.
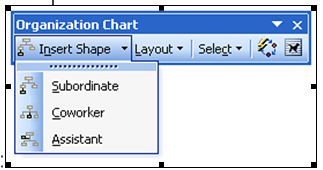
- To add a new box, click an existing box to select it, click the down arrow on the Insert Shape button on theOrganization Chart toolbar, and then click the desired relationship of the new box to the selected box, as shown below:
Or, to insert a new box with the Subordinate relationship, simply click the Insert Shape button (but not on the down arrow).
To delete a box, click on one of the box’s borders to select the box (so that eight moving handles appear around the box) and then press Delete.
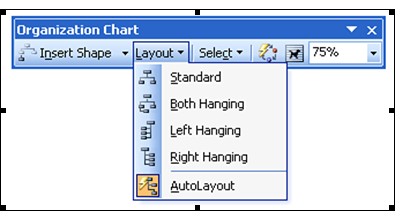
- To modify the overall structure of the organization chart, click the down arrow on the Layout button on theOrganization Chart toolbar and choose the structure you want.
You can move a particular box within the chart by dragging one of the box’s borders and dropping the box on another box.
Tip The AutoLayout command on the Layout drop-down menu (which is on by default) causes Office to automatically maintain the positions and sizes of the individual AutoShape objects that make up an organization chart (or one of the other types of diagrams described below). This option restricts the ways you can modify the AutoShapes—for example, you might not be able to drag an AutoShape to a particular position if this option is on. If you’re customizing a diagram and can’t modify an AutoShape the way you want, try turning this option off. Otherwise, you should leave it on.
- To modify the organization chart’s overall style, click the AutoFormat button on the Organization Charttoolbar and choose a style in the Organization Chart Style Gallery dialog box.
To see the name of a toolbar button in a ScreenTip, rest your mouse pointer on the button.
Create other types of diagrams
To insert a cycle, radial, pyramid, Venn, or target diagram, perform the following steps:
- On the Insert menu, click Diagram.
- In the Diagram Gallery dialog box, click the particular type of diagram you want to create and then click theOK button. Or, just double-click the diagram type.
Selecting the Organization Chart diagram type has the same effect as choosing the Insert menu, pointing toPicture, and then clicking Organization Chart. The procedure for creating an organization chart is different from that for creating the other diagram types. If you want an organization chart, follow the instructions above.

Office will insert the basic diagram and will display the Diagram toolbar. (This toolbar appears automatically whenever you select a diagram other than an organization chart.) The diagram will consist of a collection of AutoShapes, all inside a rectangular drawing area (see below).
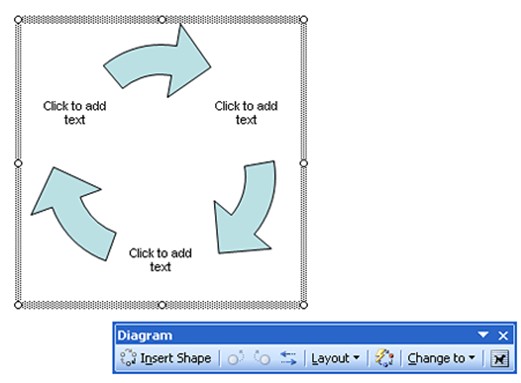
- To add text to the diagram, click in any of the AutoShapes that are labeled “Click to add text” and type in your text.
- To add a new shape to the diagram (for example, a new sector to a cycle diagram or a new level to a pyramid diagram), click the Insert Shape button on the Diagram toolbar.
To delete a shape, click on one of the AutoShape borders and press Delete.
- To rearrange your text labels within the diagram, select the AutoShape containing the particular label you want to move, and then on the Diagram toolbar, click the Move Shape Backward button to move the label within the diagram in one direction or the Move Shape Forward button to move it in the other direction.
To see the name of a toolbar button in a ScreenTip, rest your mouse pointer on the button.
- To reverse the order of the labels in the diagram, click the Reverse Diagram button on the Diagram toolbar.
- To adjust the size of the drawing area containing the diagram, click the Layout button on the Diagram toolbar and then choose an option.
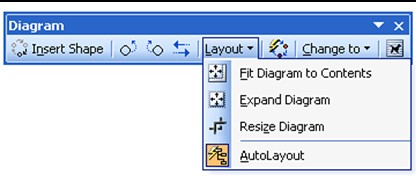
The Fit Diagram To Contents and Expand Diagram commands change the overall size of the drawing area that contains the diagram without scaling the diagram itself.
NOTE The Resize Diagram and AutoLayout commands on the Layout drop-down menu work the same way as the Resize Organization Chart and AutoLayout commands on the Layout menu for an organization chart,described above.
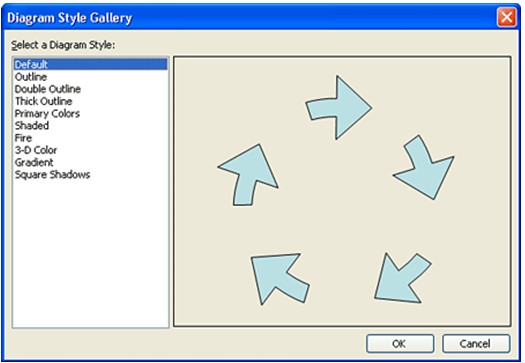
- To modify the diagram’s overall style, click the AutoFormat button and click a style in the Diagram Style Gallery dialog box.
- To convert the diagram to another type (for example, to change a cycle diagram to a Venn diagram) while preserving your text labels, click the Change To button on the Diagram toolbar and choose the drawing type you want as shown below:

Apply for MS Powerpoint Certification Now!!
https://www.vskills.in/certification/microsoft-powerpoint-certification-course
