The analysis of financial statements consists of a study of relationship and trends, to determine whether or not the financial position and results of operations as well as the financial progress of the company are satisfactory or unsatisfactory. The analytical methods or devices, listed below, are used to ascertain or measure the relationships among the financial statements items of a single set of statements and the changes that have taken place in these items as reflected in successive financial statements. The fundamental objective of any analytical method is to simplify or reduce the data under review to more understandable terms.
Analytical methods and devices used in analyzing financial statements are as follows:
- Comparative Statements
- Common Size Statements
- Trend Ratios
- Ratio Analysis
- Cash Flow Statements
- Fund Flow Statement.
Comparative Statements
These financial statements are so designed as to provide time perspective to the various elements of financial position contained therein. These statements give the data for all the periods stated so as to show:
- Absolute money values of each item separately for each of the periods stated.
- Increase and decrease in absolute data in terms of money values.
- Increase and decrease in terms of percentages.
- Comparison expressed in ratios.
- Percentages of totals.
Such comparative statements are necessary for the study of trends and direction of movement in the financial position and operating results. These calls for a consistency in the practice of preparing these statements, otherwise comparability may be distorted. Comparative statements enable horizontal analysis of figures.
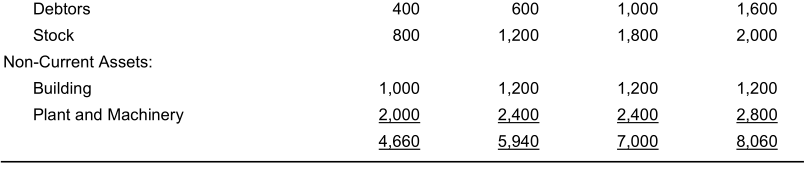
Comparative Balance Sheet: A comparative balance sheet shows the balance of accounts of assets and liabilities on different dates and also the extent of their increases or decreases between these dates throwing light on the trends and direction of changes in the position over the periods. This helps in predicting about the position of the business in future. A specimen of the comparative balance sheet is given below:
An analysis and interpretation of the above balance sheet reveals:
- Current assets have decreased by 1, 76,000 between 2012 and 2013, while current liabilities have decreased only by 1, 35,000. But this has no adverse affect on current ratio because the percentage decrease in current assets (34%) is much less than the percentage decreases in current liabilities (52%).
- Noncurrent assets have increased by 3, 95,000, major increase being a plant and machinery of 4, 76,000, which amounts to the increase in production and profit earning capacities. Increase in fixed assets appears to have been partly financed by an increase in equity capital (2, 00,000), partly by release of working capital, and partly by increase in debentures and long-term borrowings (1, 25,000).
- The increase in reserves and surpluses (42,000) may be the result of profits retained, and has gone to account for increase in long-term loans and fixed assets.
- There has been a drastic fall in cash balance (1, 08,000). This reflects an adverse cash position.
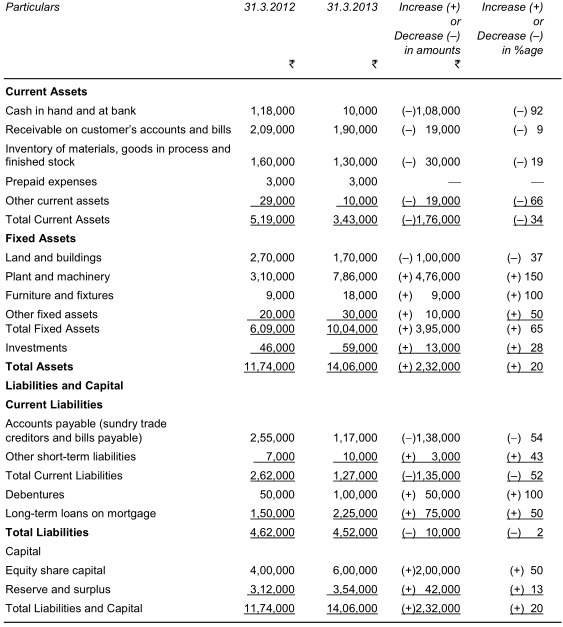
Comparative Statement of Profit and Loss or Income Statement: Comparative income statement shows the operating results for a number of accounting periods and changes in the data significantly in absolute periods and changes in the data significantly in absolute money terms as well as in relative percentage. A specimen income statement is given below:
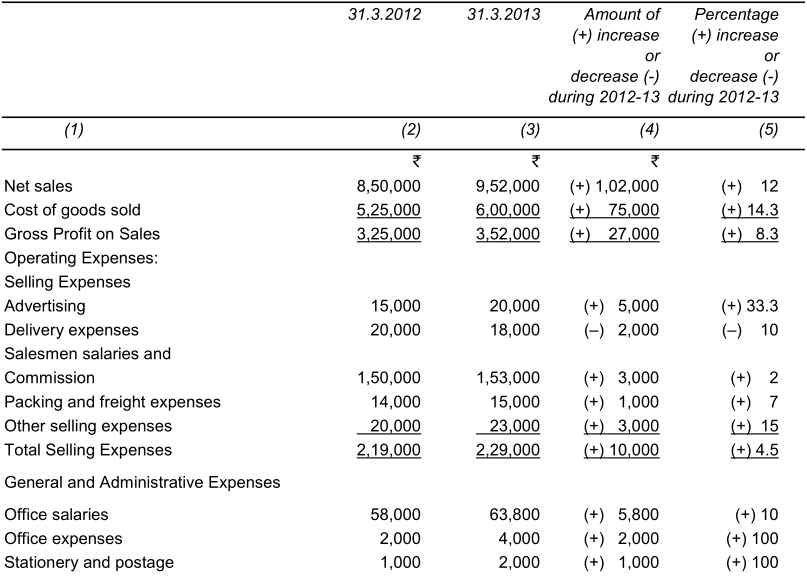
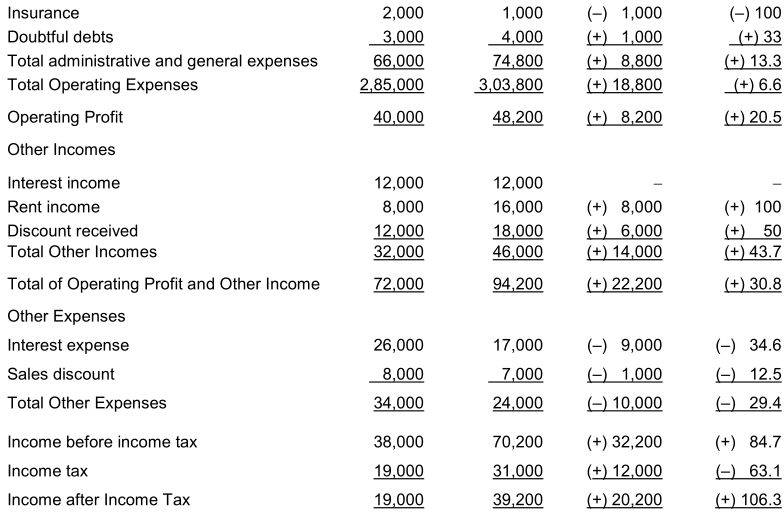
A study of the income statements reveals that there has been an increase of 1, 02,000 in sales, but at the same time cost of goods sold has also increased by 75,000. In relative terms sales increased by 12% while cost of goods sold by 14.3% It means either the addition in sales has been due to lowering of sales price or the increase in cost is due to operational inefficiency. Similarly, increase in advertising has been much more (33%) than the increase in sales (12%). But in absolute terms the amount of increase is only 5,000. Operating profits have shown an increase of 20.5% over 2012-13 but in absolute terms profits have increased only by 8,200.
There has been a substantial increase in other incomes both in relative (43.7%) as well as absolute terms (14,000). Similarly, there has been substantial decrease in other expenses (29.4% and 10,000). These items have gone to increase the total income before tax for the year by 32,200, thus reflecting that the management has been more concerned for the other incomes than the operating profits.
Common-Size Statements
In the comparative financial statements it is difficult to comprehend the changes over the years in relation to total assets, total liabilities and capital or total net sales. This limitation of comparative statements makes comparison between two or more firms of an industry impossible because there is no common base of comparison for absolute figures. Again, for an interpretation of underlying causes of changes over time period a vertical analysis is required and this is not possible with comparative statements.
Common size financial statements are those in which figures reported are converted into percentages to some common base. For this, items in the financial statements are presented as percentages or ratios to total of the items and a common base for comparison is provided. Each percentage shows the relation of the individual item to its respective total.
- Common-size Income Statement: In a common size income statement the sales figure is assumed to be equal to 100 and all other figures of costs or expenses are expressed as percentages of sales. A comparative income statement for different periods helps to reveal the efficiency or otherwise of incurring any cost or expense. If it is being prepared for two firms, it shows the relative efficiency of each cost item for the two firms.
- Common-size Balance Sheet: In a common size balance sheet, total of assets or liabilities is taken as 100 and all the figures are expressed as percentage of the total. Comparative common size balance sheets for different periods help to highlight the trends in different items. If it is prepared for different firms in an industry, it facilitates to judge the relative soundness and helps in understanding their financial strategy.
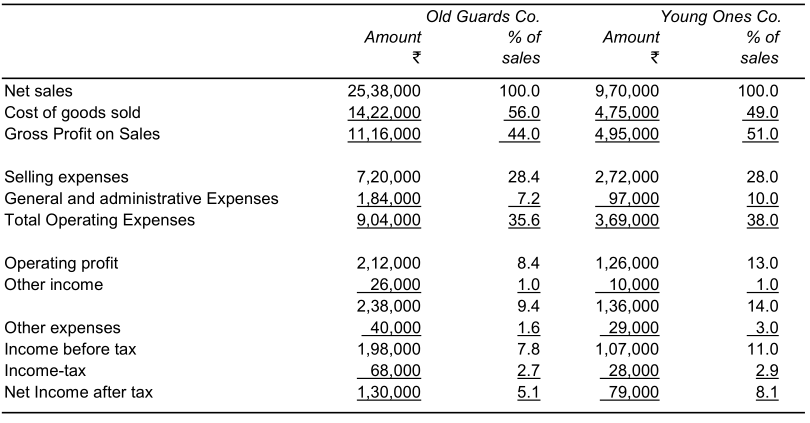
A comparative common-size income statement and balance sheet for two firms in an industry is illustrated below:
Old Guards and Young Ones Companies Comparative Income Statement Period ending 31st March, 2013
The following conclusions can be drawn from a careful analysis of the above financial statements:
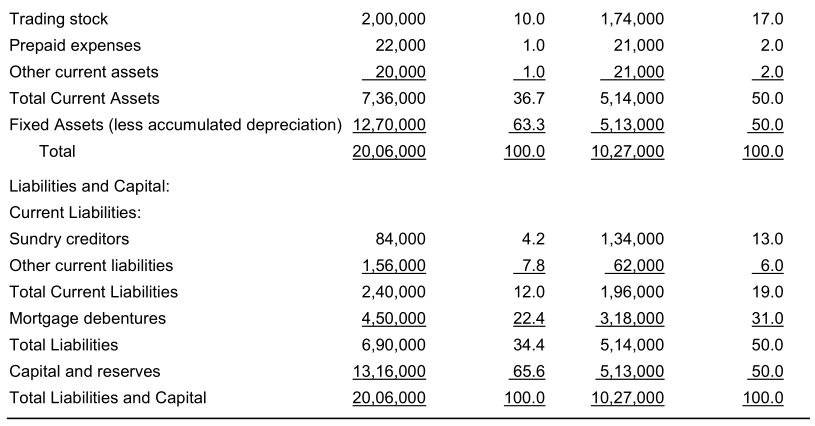
- Old Guards Company has a better and efficient credit and collection system because its debtors and trading stock amounts to 32% of total assets as compared to 39% in case of Young Ones Company.
- The cash position of Young Ones Company (7% of total assets) compares favorably with that of Old Guards (2.7%).
- The turnover of Old Guards is larger (25, 38,000) than Young Ones Company (9, 70,000), but the cost of goods absorbs a larger i.e. 56% of net sales compared to 49% in case of Young Ones Company. This reflects a better pricing mark-up by Young Ones.
- The selling, and administrative and general expenses are 35.6% of net sales in case of Old Guards while 38% in case of Young Ones. Administration costs in Young Ones are higher as compared to Old Guards, reflecting a highly paid or over staffed administrative function.
- Old Guards appear to be more traditionally financed with shareholders equity of 65.6% of total liabilities as against 50% in case of Young Ones. This reflects the financial value ability of Young Ones.
- The fixed assets of Old Guards company is larger (12, 70,000) than of Young Ones Company (5, 13,000). But, if this is compared with turnover that of the two companies, we find that Old Guards has a lower asset turnover (50%) than that of Young Ones Company (53%). This reflects better asset utilization by Young Ones Company.
Trend Ratios
Trend ratios can be defined as index numbers of the movements of the various financial items in the financial statements for a number of periods. It is a statistical device applied in the analysis of financial statements to reveal the trend of the items with the passage of time. Trend ratios show the nature and rate of movements in various financial factors. They provide a horizontal analysis of comparative statements and reflect the behavior of various items with the passage of time. Trend ratios can be graphically presented for a better understanding by the management. They are very useful in predicting the behavior of the various financial factors in future. However, it should be noted that conclusions should not be drawn on the basis of a single trend. Trends of related items should be carefully studied, before any meaningful conclusion is arrived at. Since trends are sometimes significantly affected by externalities, i.e. reasons extraneous to the organizations, the analyst must give due weight age to such extraneous factors like government policies, economic conditions, changes in income and its distribution, etc
Computation of Trend Percentages: For calculation of the trend of data shown in the financial statements, it is necessary to have statements for a number of years, and then proceed as under:
- Take one of the statements as the base with reference to which all other statements are to be studied. In selection of the best statement, it should be noted that it belongs to a ‘normal’ year of business activities. Statement relating to an ‘abnormal’ year should not be selected as base; otherwise the trend calculated will be meaningless.
- Every item in the base statement is stated as 100.
- Trend percentage of each item in other statement is calculated with reference to same item in the base statement by using the following formula:
Absolute Value of item (say cash) in other statements x 100
Absolute Value of same item (cash) in base statement
Limitations of Trend Ratios: It should be noted that trend ratios are not calculated for all items. They are calculated only for logically connected items enabling meaningful analysis. For example, trend ratios of sales become more revealing when compared with the trend ratios of fixed assets, cost of goods sold and operating expenses. Trend ratios have the following limitations:
- If the accounting practices have not been consistently followed year after year, these ratios become incomparable and thus misleading.
- Trend ratios do not take into consideration the price level charges. An increasing trend in sales might not be the result of larger sales volume, but may be because of increased sales price due to inflation. In order to avoid this limitation, figures of the current year should be first adjusted for price level changes from the base year and then the trend ratios be calculated.
- Trend ratios must be always read with absolute data on which they are based, otherwise the conclusions drawn may be misleading. It may be that a 100% change in trend ratio may represent an absolute change of 1,000 only in one item, while a 20% change in another item may mean an absolute change of 1, 00,000.
- The trend ratios have to be interpreted in the light of certain non-financial factors like economic conditions, government policies, management policies etc.
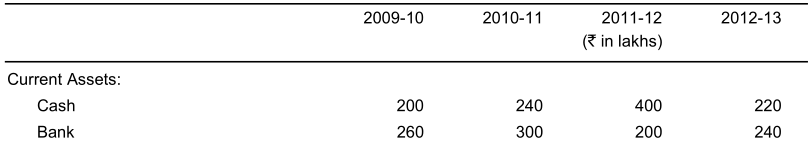
Illustration 1
From the following information extracted from the Balance Sheets of Star Ltd. for four previous financial years, calculate the trend percentages taking 2009-10 as the base year: