For distributions summarizing data from continuous measurement scales, statistics can be used to describe how the distribution rises and drops.
Symmetric
Distributions that have the same shape on both sides of the center are called symmetric and those with only one peak are referred to as a normal distribution.
Skewness
It refers to the degree of asymmetry in a distribution. Asymmetry often reflects extreme scores in a distribution. Positively skewed is when it has a tail extending out to the right (larger numbers) so, the mean is greater than the median and the mean is sensitive to each score in the distribution and is subject to large shifts when the sample is small and contains extreme scores. Negatively skewed has an extended tail pointing to the left (smaller numbers) and reflects bunching of numbers in the upper part of the distribution with fewer scores at the lower end of the measurement scale.
The first thing you usually notice about a distribution’s shape is whether it has one mode (peak) or more than one. If it’s unimodal (has just one peak), like most data sets, the next thing you notice is whether it’s symmetric or skewed to one side. If the bulk of the data is at the left and the right tail is longer, we say that the distribution is skewed right or positively skewed; if the peak is toward the right and the left tail is longer, we say that the distribution is skewed left or negatively skewed.
Look at the two graphs below. They both have μ = 0.6923 and σ = 0.1685, but their shapes are different.
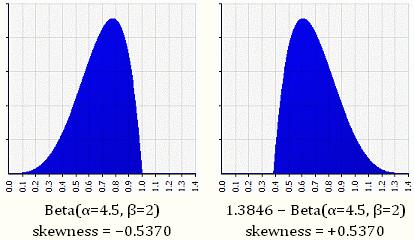
The first one is moderately skewed left: the left tail is longer and most of the distribution is at the right. By contrast, the second distribution is moderately skewed right: its right tail is longer and most of the distribution is at the left.
Types of Skewness
- Positively skewed – A distribution is positively skewed when is has a tail extending out to the right (larger numbers) When a distribution is positively skewed, the mean is greater than the median reflecting the fact that the mean is sensitive to each score in the distribution and is subject to large shifts when the sample is small and contains extreme scores.
- Negatively skewed – A negatively skewed distribution has an extended tail pointing to the left (smaller numbers) and reflects bunching of numbers in the upper part of the distribution with fewer scores at the lower end of the measurement scale.
The relationship between skew and the relative size of the mean and median led the statistician Pearson to propose the following simple and convenient numerical index of skew
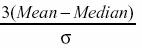

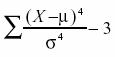
There is more than one measure of skew. Although Pearson’s measure is a good one, the following measure is more commonly used. It is sometimes referred to as the third moment about the mean.
Kurtosis
Like skewness, kurtosis has a specific mathematical definition, but generally it refers to how scores are concentrated in the center of the distribution, the upper and lower tails (ends), and the shoulders (between the center and tails) of a distribution.
Types of Kurtosis
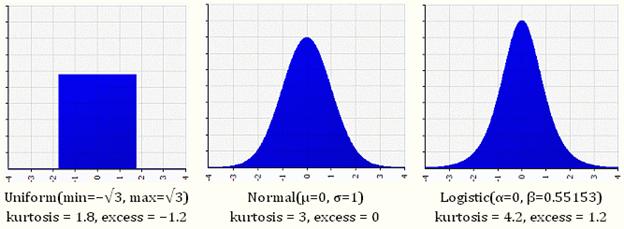
- Mesokurtic – A normal distribution is called mesokurtic. The tails of a mesokurtic distribution are neither too thin or too thick, and there are neither too many or too few scores in the center of the distribution.
- Platykurtic – Starting with a mesokurtic distribution and moving scores from both the center and tails into the shoulders, the distribution flattens out and is referred to as platykurtic.
- Leptokurtic – If you move scores from shoulders of a mesokurtic distribution into the center and tails of a distribution, the result is a peaked distribution with thick tails. This shape is referred to as leptokurtic.
The value “3” is subtracted to define “no kurtosis” as the kurtosis of a normal distribution. Otherwise, a normal distribution would have a kurtosis of 3.
Kurtosis is unfortunately harder to picture than skewness, but these illustrations, should help. All three of these distributions have mean of 0, standard deviation of 1, and skewness of 0, and all are plotted on the same horizontal and vertical scale. Look at the progression from left to right, as kurtosis increases.