A simple measure of dispersion is the range of values, which is simply the difference between the highest and lowest values.
Other measures commonly used are as:
- Variance: It is the mean of the squares of deviations of individual returns around their average value
- Standard deviation: It is the square root of variance
- Beta: This reflects how volatile is the return from an investment in response to market swings
Variance and Standard Deviation are defined as
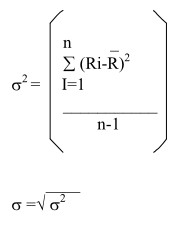
Where σ2 = variance of return
σ = standard deviation of return
Ri =return from the stock in period I (I=1,…,n)
_
R = arithmetic return
N=number of periods
Illustration:
Consider the following example of the return from a stock over a period of 6 years
R1=15%,R2=12%,R3=20%,R4=-10%,R5=14%,R6=9%
The variance and standard deviation of returns are calculated as Follows:
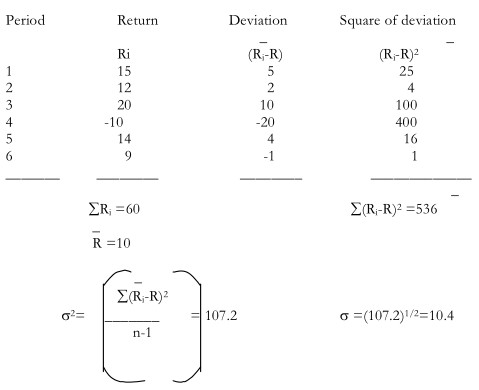
Therefore you can see that
- The difference between the various values and the mean value are squared. This means that the values which are far away from the mean value have a much more impact on standard deviation than values which are close to the mean value.
- The standard deviation is obtained as the square root of the average of squared deviations. This means that the standard deviation and the mean are measured in the same units and hence the two can be directly compared.
Criticism of Variance as Measure of Risk
Two main criticisms of the use of variance as a measure of risk are:
- Variance considers both positive and negative deviations. Some researchers argue that only negative deviations should be considered while measuring risk. Markowitz suggests a measure of downside risk called semi variance. Semi variance is calculated in the same way as variance but considers only negative deviations. As long as the returns are disturbed symmetrically , variance is simply two times semi-variance and it does not make any difference if variance is used or semi-variance is used.
- When the probability distribution is not symmetrical around its expected value, variance alone does not suffice. In addition to variance, the skewness of the distribution should also be used. Markowitz model justify the use of variance on the grounds that the historical returns of stocks have been approximately symmetrical.
Rationale for Standard Deviation
Notwithstanding the above criticisms standard deviation (the square root of variance) is commonly used in finance as a measure of risk
The reasons are:
- If a variable is normally distributed, its mean and standard deviation contain all the information about its probability distribution. The probability that a particular outcome will be above or blow, a specified value can be determined. 68.3% of the values fall within a band of one standard deviation on either side of the arithmetic mean. This % increases to 95% for 2 standard deviations and 99% for 3 S.D.s.
- If the utility of money is represented by a quadratic function (a function commonly suggested to represent diminishing marginal utility of wealth),then the expected utility is a function of mean and standard deviation.
- D is analytically more easily tractable.
