Product maps identify which products, companies or services compete in a market. Maps provide a clear description of the structure of a market and suggest possible segmentation strategies.
- Identifying Product Weaknesses Maps show how products are viewed or rated on specific attributes or dimensions. Analysis of maps can identify weaknesses on attributes and suggest new advertising and/ or positioning strategies.
- Concept Development and Evaluation Proposed new product concepts can be developed and evaluated by examining how they stack up against existing products.
- Tracking Consumer Perceptions Product mapping is an ideal way to track shifts in consumer perceptions of products or services over time.
- Identifying Differences among Groups You may want to determine whether distinct groups of people (i.e. users vs. non users, men vs. women) perceive your products differently. Product mapping is an excellent way to determine if differences exist between the perceptions of distinct groups.
Perceptual maps represent the positions of products on a set of evaluative dimensions.
Perceptual maps and positioning studies do not tell us
- How to obtain a certain position; or
- Possible new attributes not currently available in existing brands.
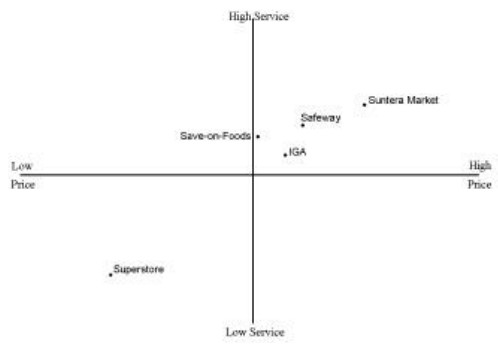
Sample Perceptual Map for Local Grocery Stores
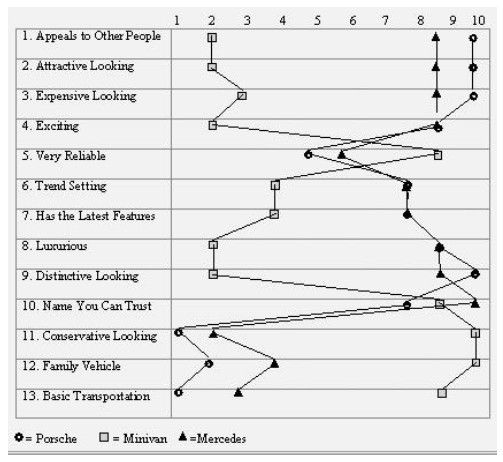
Snake-plot Perceptual Map
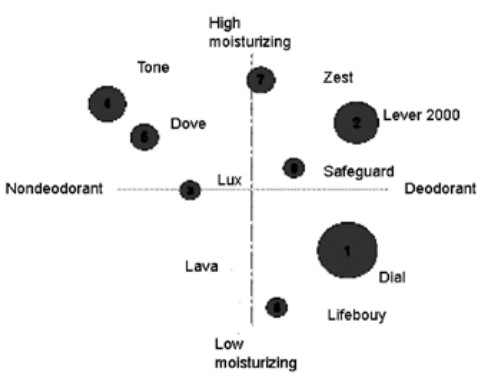
Perceptual Map – soaps
Perceptual mapping involves mapping how
- Consumers perceive the similarity and dissimilarity between a set of competing brands or products.
- The closer two brands are in a perceptual map, the more they are perceived to be similar. The farther away any two brands are in the map, the more dissimilar they are perceived to be.
- The dimensions of the perceptual map are used to understand the attributes consumers use to compare brands.
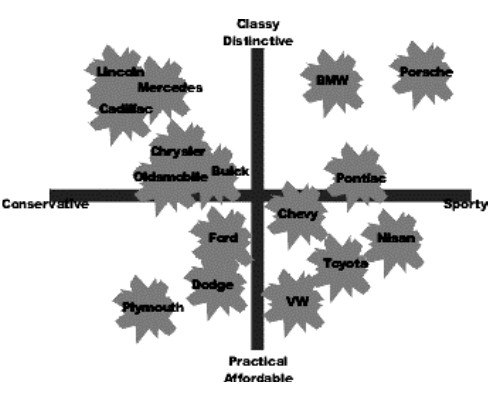
The first perceptual map below shows consumer perceptions of various automobiles on the two dimensions of sportiness/ conservative and classy/affordable. This sample of consumers felt Porsche was the sportiest and classiest of the cars in the study (top right corner). They felt Plymouth was most practical and conservative (bottom left corner).
Perceptual Map of Competing Products
Cars that are positioned close to each other are seen as similar on the relevant dimensions by the consumer. For example consumers see Buick, Chrysler, and Oldsmobile as similar. They are close competitors and form a competitive grouping. A company considering the introduction of a new model will look for an area on the map free from competitors. Some perceptual maps use different size circles to indicate the sales volume or market share of the various competing products.
A company considering introducing a new product will look for areas with a high density of ideal points. They will also look for areas without competitive rivals. This is best done by placing both the ideal points and the competing products on the same map.
Some maps plot ideal vectors instead of ideal points. The map below, displays various aspirin products as seen on the dimensions of effectiveness and gentleness. It also shows two ideal vectors. The slope of the ideal vector indicates the preferred ratio of the two dimensions by those consumers within that segment. This study indicates there is one segment that is more concerned with effectiveness than harshness, and another segment that is more interested in gentleness than strength.
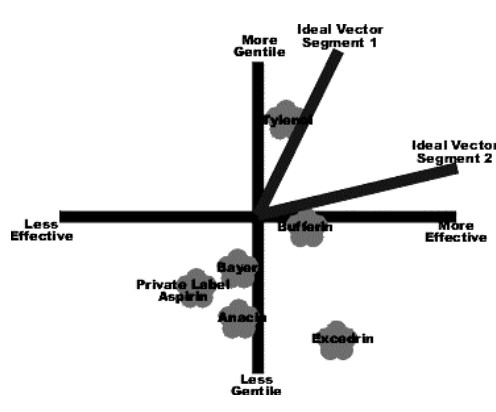
Perceptual Map of Competing Products with Ideal Vectors Perceptual maps need not come from a detailed study. There are also intuitive maps (also called judgmental maps or consensus maps) that are created by marketers based on their understanding of their industry. Management uses its best judgment. It is questionable how valuable this type of map is. Often they just give the appearance of credibility to management’s preconceptions.
When detailed marketing research studies are done method- of logical problems can arise, but at least the information is coming directly from the consumer. There is an assortment of statistical procedures that can be used to convert the raw data collected in a survey into a perceptual map. Preference regression will produce ideal vectors. Multi dimensional scaling will produce either ideal points or competitor positions. Factor analysis, discriminate analysis, cluster analysis, and logit analysis can also be used. Some techniques are constructed from perceived differences between products; others are constructed from perceived similarities. Still others are constructed from cross price elasticity of demand data from electronic scanners.
Perceptual mapping techniques identify the underlying dimensions that differentiate consumer perceptions of products and the posit ions of existing products on the dimensions Consumers are asked to rate a set of brands along given attributes or benefits or they may be asked merely to judge, by pairs, how similar or dissimilar the brands are.
