The following proposed steps can be performed to analyze logistics costs and assess the efficacy of logistics systems
- Define the major factors that drive fixed and variable costs.
- Assess variables that affect cost drivers.
- Define relevant fixed and variable costs.
- Calculate relevant fixed and variable costs.
- Assess unit costs and total costs.
- Analyze decisions.
Define the Major Factors That Drive Fixed and Variable Costs
The first step in conducting a cost analysis is to determine what resources are involved in carrying out the logistics function you are assessing and to understand how those resources are being used. In other words, the aim of this step is to describe the factors that have an impact on the fixed and
variable costs that you are concerned about and that you think/know will change when these factors change. We call these factors cost drivers
Cost Drivers of Transport
- the total capacity for distribution in a system
- the total distance to be traveled in the system.
For example, the major resources required for transporting and distributing products are distribution vehicles (trucks or other transport mechanisms) and costs associated with operating these vehicles. Fixed and variables costs will be incurred depending on how these resources are used. Capacity refers to the size and number of accessible distribution vehicles, and it will affect the fixed costs incurred for distribution. The total distance to be covered affects how much distribution vehicles will be used, and it will influence the total variable costs to be incurred.
It is worth noting that cost drivers can also be linked. For example, the number of vehicles and the carrying capacity of each vehicle will affect the number of trips required to complete a distribution cycle and the total distance covered to complete the cycle. Evaluated in financial terms, this trade-off is often at the heart of defining the most cost-effective solutions for transport problems, and it forms the basis for most transport cost issues.
The management of cost drivers is central to the analysis and management of costs. In addition to managing the variables that affect cost drivers (step 2), one of the important levers that can be affected is the logistics system design.
The factor of design is defined at a high level and includes the inventory level (or order level/volume) in the system and the system to control that inventory (or the frequency of order). A feature, such as the order level, defined in the logistics system will influence the volume to be distributed in a given delivery cycle or the required capacity. The frequency of orders (or deliveries) will be reflected in the total distance that will need to be covered over a period of time (e.g., a year for cost analysis purposes). In the case of transport cost analysis, the delivery routes in a logistics system—the location of delivery points, the network of connections (roads, etc.) between the points, and the distance between them—can also be considered a feature of design that affects the major cost drivers. Typically, the delivery routes are also designed based on an assessment of distribution costs and, therefore, can be considered a variable that will influence the cost drivers (step 2).
This is because delivery routes can be optimized based on the size and number of vehicles to be deployed to cover routes (in turn, depending on the volume to be delivered to delivery points) balanced against the frequency of trips or total distance needed to cover the route. Said another way, delivery routes are both an element of the design factor and a variable for assessing the major cost drivers.
Assess Variables That Affect Cost Drivers
This next step assesses the variables that will influence the major cost drivers. This step uses these variables to link the resources used in a logistic system with the design of the distribution system. Before defining the variables, appropriate measures of the cost drivers need to be defined. After the cost associated with these measures is determined (step 3 of these guidelines), these measures will form the basis for a cost analysis. To do this in the case of transport, we refer back to the description of the cost drivers (capacity and distance), and the following measures can be defined.
Vehicle-days are a practical and useful measure of distribution capacity because they quantify the capacity of a vehicle in terms of the number of days that a vehicle is available for operation (for example, in a year) or the number of days a vehicle has been in operation. With this approach, the
ability of a vehicle to deliver a given volume of goods in a period of time is estimated based on the number of vehicle-days required to complete the delivery (depending on the carrying capacity of the vehicle and, therefore, the number of trips required to deliver that volume). The result is typically compared to the number of vehicle-days the vehicle is actually available to operate within a delivery period to determine the total number of vehicles required. For example, more than one vehicle would be needed if the number of vehicle-days required is greater than the number of vehicle-days available.
Table 1 outlines the variables that can be analyzed for transport cost drivers. Note that, given the nature of variables influencing both cost drivers, one factor can be a limiting factor for the other factor. For instance, variables that influence the “total days” required to cover a given distance (such as the speed of the vehicle and the loading and unloading time required at each delivery point) will limit the “total kilometers” to be covered in a day. A variable such as the legally allowable time that a truck driver can operate a truck in a day will determine the number of “vehicle-days” (measure of capacity) but will also have an effect on the “total days” required to cover a given distance.
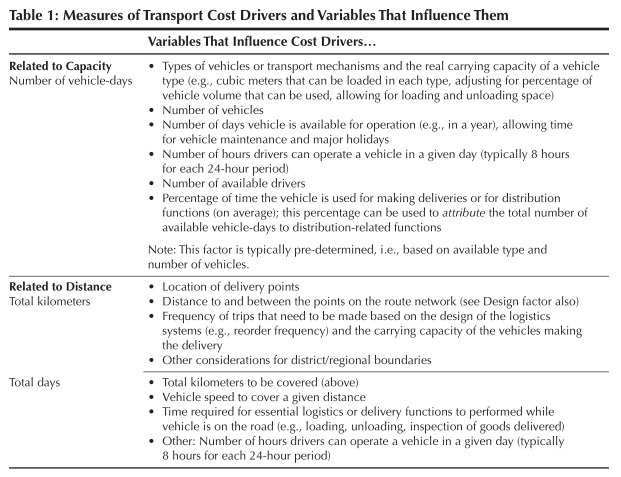
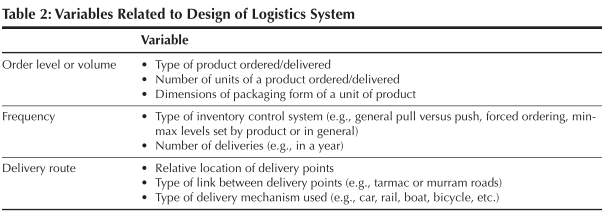
The design of the logistics system has an impact on both capacity and distance; it can also be disaggregated and analyzed into its own influencing variables, as shown in table 2. Though these are not costed, they contribute to a better understanding of the cost drivers. The main factors for consideration related to design are the volume level of products that need to be distributed in the system and the frequency of distribution. The delivery route can also be part of the design, and it is divided into more detail in table 1 as variables affecting the distance cost driver.
The major effort required in this step is to assess the variables defined in table 1 and, hence, the condition of the logistics system as it relates to the variables. This involves developing an understanding of how the distribution system works and how the products move through the system, and the people who are involved. In other words, this is conducting an assessment/survey/information collection activity. DELIVER has done a lot of work with logistics system assessments, culminating in assessment tools— the Logistics Indicator Assessment Tool (LIAT) and the Logistics System Assessment Tool (LSAT)
In the case of transport cost analysis, if computerized geographical and/or logistics management information systems are not available, it is often too costly or time-consuming to evaluate all delivery positions in a logistics system to assess the variables related to distance or capacity. While this would be the ideal, analyses can default to sampling representative regional or national sites of the logistics system until data is experientially compiled on the whole system.
Some general guidelines may be useful to make the sampling relevant and as representative as possible:
- If possible, stratify survey sites and survey all major site types. Criteria for stratification depend to a large extent on the specific objective of the cost analysis, and should relate to major factors that are expected to influence total costs. In the case of transport, for example, criteria related to the major cost drivers should be considered, such as remote versus nearby sites, and high volume/demand versus low volume/demand sites. Selection of criteria should increase confidence that the types of sites that will be most costly to distribute to are well understood.
- Sample in a way that facilitates a reasonable mechanism for projecting results of the survey. For example, in a transport cost analysis for the National Medical Stores in Uganda, in addition to factors related to cost drivers, sampling criteria included population size/density and the relative complexity of district distribution network (i.e., large or small number of sub-districts to deliver to at the district level). Doing so allowed analysts to estimate national distribution costs for NMS based on per capita population-based projections, as well as per sub-district-based projections. Interestingly, findings from both approaches did not differ significantly, increasing confidence that estimates of national costs were relatively representative.
- Use estimates where precise measures are not realistically collected in a short amount of time. This is applicable for any of the factors or cost drivers. For example, in the transport cost study for NMS in Uganda, to facilitate the calculation of the total volume delivered, the team categorized essential drug products into three major groups, depending on their packaging size (large, medium, and small). The team estimated the average volume of a large, medium, and small package based on a sample of 10 packaging forms in each group.
Define Relevant Fixed and Variable Costs
This step describes fixed and variable resources associated with the factors that influence the cost of a logistics system. Later in this section, you will find brief descriptions about how to measure these fixed and variable costs. The approaches for measuring the costs can be used to define the resources that would be required if a transport system is being designed, as well as to evaluate the existing costs of a transport system.
Table 3 provides examples of the costs that are associated with the cost drivers defined for transport.
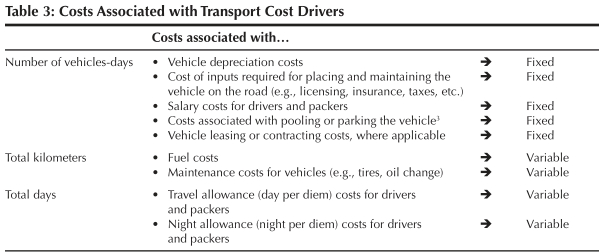
Depending on the type of analysis required, other related indirect transport costs may also be analyzed, but they are not indicated above. For example, if the entire Transport and Distribution Unit was being evaluated, to evaluate the total performance of the distribution function, it may be important to consider indirect costs. Indirect costs can also be fixed or variable costs as defined above. Examples of indirect distribution-related costs include—
- Other personnel salary costs involved in transport function (typically fixed costs): e.g., pickers and packers in the warehouse, transport managers, and general managers, depending on the extent of time they devote to transport functions.
- Inventory handling resources: e.g., warehousing and/or building resources (equipment, staff, space, security costs), information systems devoted to storing and managing the products to be transported/delivered or to scheduling and tracking shipment (including associated personnel costs and communications costs).
Calculate Relevant Fixed and Variable Costs
Until now, the major cost drivers have been identified (step 1), measured (step 2), and their major cost components identified (step 3). The focus in this step is to calculate the cost of these cost driver measures. The following sections describe general approaches for conducting this calculation. The descriptions provide highlights of these approaches and of typical issues that may arise in doing these calculations. Several references are available to provide more detailed or specific description, and the reader is encouraged to look at these.
Assess Unit Costs and Total Costs
Unit costs can be used to assess the effect of changing an aspect of the system and measuring its impact on costs, e.g., the effect of changing an aspect of a cost driver. Until this step of the guide, unit costs have been expressed for both fixed and variable cost types and for transport systems have been expressed on a—
- per vehicle-day,
- per kilometer, or
- per day basis.
Therefore, unit costs provide a link between the cost of a logistics system and the design (and performance) of that system. The design of the logistics system becomes a major driver of the level of resource utilization.
Potentially, more trips would be needed to make the deliveries, which would increase the distance covered. Distance can be multiplied by the estimate of unit cost per kilometer (see step 4) to calculate the increase in total variable cost of fuel. More distance to cover may involve more time for the vehicle to be on the road. The additional time could be multiplied by the cost per day to calculate another element of total variable costs.
Unit fixed costs (cost per vehicle-day) may actually decrease from increased vehicle utilization (vehicles would be on the road for more time, therefore, fixed costs would be divided by a higher number of vehicle-days on the road). This would be true up to the point where vehicle utilization does not exceed the available vehicle-days that the vehicle can be on the road.
Analyze Decisions
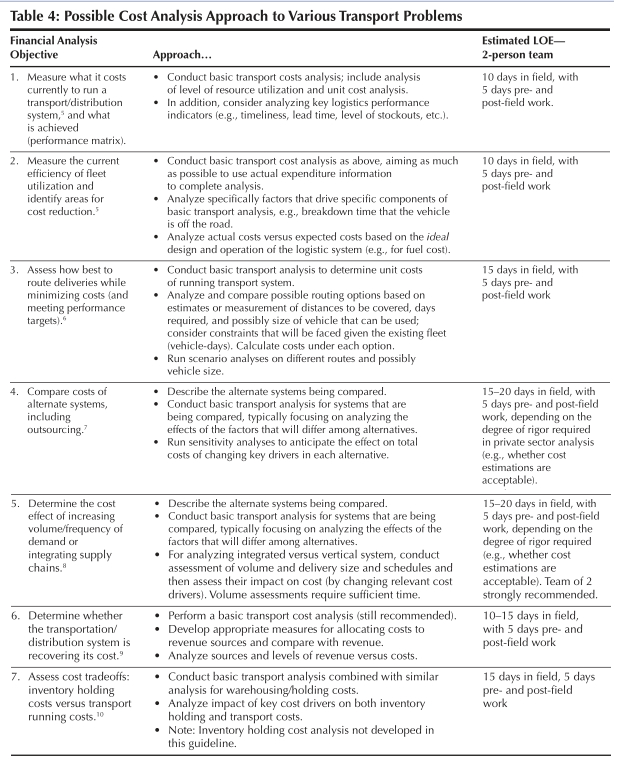
Several approaches are available for analyzing costs and making decisions. Table 4 presents some examples of the types of transport problems that an analyst might come across; a preliminary outline details the possible approaches to addressing them. The level of effort (LOE) required to analyze a particular problem clearly depends on several factors, including the degree of rigor required in the analysis, the level of decision making required (strategic versus operational), and the access to information for analysis. LOE typically assumes a two-person team.
Some general guidelines are beneficial when you assess various design features of a logistics system and their impact on cost drivers, and total costs:
- Linking unit costs and total costs implies linking the cost drivers (as defined, for example, for transport in table) with the costs associated with these cost drivers (as defined in table 2 for transport). One approach is to systematically map this link for each of the cost drivers. As another example, consider the network of links between delivery points, a cost driver related to total kilometers. Changing assumptions related to the network would mean changing the distance between delivery points; this, in turn, would mean changing the distance traveled to cover the points and potentially the time taken to do so (e.g., based on the various road conditions and links). Various calculations (or sensitivity analysis) can now be performed to assess the impact of network design on the cost of total kilometers or, for example, the total cost of fuel.
- Implicit in the above, keeping track of assumptions made when conducting cost analysis increases the value of the analysis. Assumptions are made about various aspects of cost analysis. They relate to the measures of cost drivers (e.g., the number of operating days the vehicle can be on the road or the average speed of a vehicle), as well as the elements that are part of assessing costs (e.g., the choice of the approach to measure the cost of fuel or the value of a vehicle). Assumptions include factors that are considered as given in the cost analysis. They also include factors that are held constant in the course of the analysis in order to avoid making the analysis too complex, and in the absence of more accessible information (e.g., assumptions about the average price of fuel in a given year to estimate the unit cost of fuel). Documenting these assumptions is a systematic way of allowing anyone who considers the analysis to understand its premise and its results. Clearly stated assumptions enable decision makers who are interested in applying the results to a different situation to carefully assess whether the assumptions hold in that situation. Then, assumptions are easier to test and modify if needed, and then assess their impact on the final results.
- Where possible, perform a sensitivity analysis to build a better understanding of major factors or assumptions that drive the results of a cost analysis. Sensitivity analysis or what-if scenario analysis allows the analyst to measure how projected results may vary along with changes in the key assumptions on which the projections are based. Sensitivity analysis is also a check on the results of the analysis to make sure that all factors that might affect the stability of a decision have been considered and their impact anticipated. For instance, sensitivity analysis can be based on variations in the estimate of total distance or days (both measures of the distance cost driver in transport cost analysis). For a discussion of sensitivity analysis applied to transport analysis.
- As highlighted earlier, both fixed and variable costs related to the logistics system should be considered. The trade-off between these two costs is often at the core of decisions to be made related to the logistics system (e.g., whether or not to outsource, how to manage buyer and supplier type negotiations, etc.). One way to do this is to consider the impact of cost drivers on both fixed and variable costs when linking unit costs and cost drivers.
- While the definition of what constitutes fixed and variable costs is standard, the determination of what to include or not include in measuring these costs depends on the situation and organizational structure, in addition to the objective of the analysis. This guideline means that a general prescriptive approach to measuring costs of a logistics system is less useful. Instead, it is important to recognize that all costing is local and needs to be considered in the context where it is being completed. For instance, the cost of vehicles may be considered as part of fixed or variable costs, depending on whether the organization owns its vehicles or hires vehicles for specific deliveries or distances. Another type of example has to do with whether or not to include a cost item in measuring costs. A cost analysis should focus on costs that are expected to change as a result of the changes being considered (rather than assessing all costs). In a situation where alternatives are being compared, for instance, analysis should focus on what is different between the different options being considered, and then measure costs to assess this difference. This approach is sometimes called incremental cost analysis.
- A basic cost analysis approach in logistics management is to compare expected costs against actual costs of systemic or functional costs. Expected costs are projections of what logistics costs should be under the best case or ideal scenario, where the logistics system or logistics function (e.g., transport or warehousing) operate as planned. Comparing actual logistics costs against expected costs highlights areas where costs deviate significantly from the ideal; this, in turn, triggers an analysis of costs and logistics practices to investigate interventions for minimizing deviations.
- A note on contracting (or outsourcing): This is an area of interest in the logistics management field as organizations try to reduce the cost of owning and managing capital assets (often with high opportunity costs) and attempt to outsource to outside firms the functions performed with these assets. The implication for the cost analysis framework that was described earlier is that some of the costs we have defined as fixed costs would likely be shifted to being variable costs and be treated accordingly. For example, the cost of vehicle-days described in previous examples would be replaced with an estimate of leasing costs that may vary based on the period of time a vehicle is being leased to make deliveries. If distribution is contracted out altogether (e.g., for a period of time) however, contracting-related costs may replace the cost of vehicle-days; contracting costs may be considered fixed costs. Definitions of the appropriate cost driver would still be needed.
