Spreadsheet packages are good at numerical handling and have a wide range of monetary and statistical functions. Calculations are easily presented in a readable form and to mix text and graphical display. Spreadsheets are inordinately popular, widely available and easy to use.
- The flexibility of spreadsheets makes it possible to use them to tackle problems that would be more appropriately modeled with different software.
- Their availability and ease of use makes this an extremely common mistake.
- Before one can design a spreadsheet, he/she needs to make sure that a spreadsheet is the most appropriate tool for the job.
Excel has a wide range of add-in functions that allows a lot of specific calculations. Many of these can be very useful, but if it is found that many are used, it may suggest specialist packages. For example, if a person is using a lot of the database functions, he probably should be using database software.
The table below compares the strengths and weaknesses of a number of different analysis packages.
| Software Type | Strengths | Weaknesses |
| Spreadsheets
e.g.: Microsoft Excel, Lotus 123 |
numeric manipulation;
financial functions; user interface; graphical reports; easy to learn; and time series modeling. |
handling large quantities of data;
multi-dimensional data; systems with feedback or circularity; looping and branching; and can develop “black box” systems. |
| Databases
e.g.: Microsoft Access |
handling large volumes of data;
user interface; can develop “black box” systems; and Multi-dimensional data. |
complex calculations;
complex report structures; graphical reports; and time series modeling. |
| Statistical software e.g.: SAS | handling large volumes of data; and
Complex statistical functions. |
expensive; and
More difficult to learn. |
| Multi-dimensional packages
e.g.: Oracle Financial Analyser |
multi-dimensional data;
handling large volumes of data; “slice and dice” reporting; and Aggregation of data. |
specialised use;
more difficult to learn; expensive; and used more for information reporting than modeling. |
| System Dynamics packages
e.g.: Vensim, Powersim |
systems with feedback or circularity;
“soft” variables such as staff morale; multi-dimensional data; and graphical representation of the model structure. |
producing financial statements;
difficult to understand and accept the processes; and specialised skills required to develop and maintain. |
| Rules based packages
e.g.: Applications Manager |
can develop “black box” systems; and
looping and branching. |
specialised use; and
more difficult to learn. |
MS-EXCEL Window Elements
Microsoft Excel is a Spreadsheet package that is widely used for data analysis purpose. The work-space called the workbook is divided into a number of sheets called the worksheet. The screen that appears on opening MS-EXCEL is-
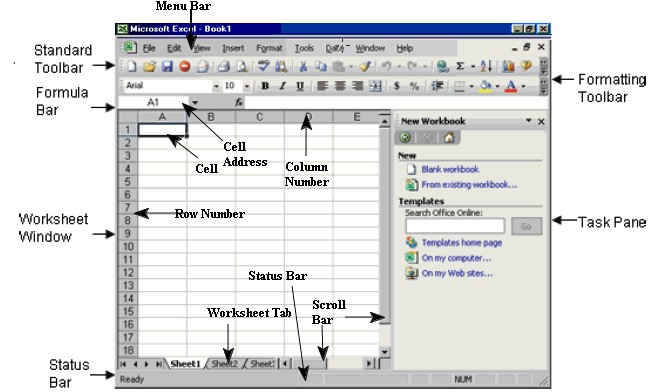
- Menu Bar – It is below the title bar of the window, listing all drop down menu of MS-Excel It has nine drop down menus.
- Status Bar – It is placed at the bottom of the window display status of keyboard lock keys (Num, scroll, Caps) and other computed result
- Row and Row Number – The horizontal lines are called the rows these are numbered 1,2,3 and so on up to 65536.
- Column and Column Number – The vertical lines are called the columns these named A, B, C and so on up to IV.
- Cell – The intersection of the rows and the columns is called the cell.
- Cell Address – The cell address comprises of the column name and the row address; therefore, the cell address of the very first cell would be A1 i.e. first column and first row.
- Workbooks – In Microsoft Excel, a workbook is the file in which we work and store our data.
- Worksheets – Use worksheet (The primary document that we use in Microsoft Excel to store and work with data. It is also called as a spreadsheet.
- Work Sheet tabs – The names of the sheets appear on tabs at the bottom of the workbook window. To move from sheet to sheet, click the sheet tabs.
