It leverages statistics to predict outcomes. Most often the event one wants to predict is in the future, but predictive modeling can be applied to any type of unknown event, regardless of when it occurred. For example, predictive models are often used to detect crimes and identify suspects, after the crime has taken place.
In many cases the model is chosen on the basis of detection theory to try to guess the probability of an outcome given a set amount of input data, for example given an email determining how likely that it is spam.
Models can use one or more classifiers in trying to determine the probability of a set of data belonging to another set, say spam or ‘ham’.
Depending on definitional boundaries, predictive modeling is synonymous with, or largely overlapping with, the field of machine learning, as it is more commonly referred to in academic or research and development contexts. When deployed commercially, predictive modeling is often referred to as predictive analytics.
Usage
Predictive models can either be used directly to estimate a response (output) given a defined set of characteristics (input), or indirectly to drive the choice of decision rules.
Depending on the methodology employed for the prediction, it is often possible to derive a formula that may be used in a spreadsheet software. This has some advantages for end users or decision makers, the main one being familiarity with the software itself, hence a lower barrier to adoption.
Nomograms are useful graphical representation of a predictive model. As in spreadsheet software, their use depends on the methodology chosen. The advantage of nomograms is the immediacy of computing predictions without the aid of a computer.
Point estimates tables are one of the simplest form to represent a predictive tool. Here combination of characteristics of interests can either be represented via a table or a graph and the associated prediction read off the y-axis or the table itself.
Tree based methods (e.g. CART, survival trees) provide one of the most graphically intuitive ways to present predictions. However, their usage is limited to those methods that use this type of modelling approach which can have several drawbacks. Trees can also be employed to represent decision rules graphically.
Score charts are graphical tabular or graphical tools to represent either predictions or decision rules.
A statistical model embodies a set of assumptions concerning the generation of the observed data, and similar data from a larger population. A model represents, often in considerably idealized form, the data-generating process. The model assumptions describe a set of probability distributions, some of which are assumed to adequately approximate the distribution from which a particular data set is sampled.
A logic-driven is based on experience, knowledge and logical relationships of variable and constants connected to the desired performance outcome. To help conceptualize the relationships inherent in a system, diagramming methods are useful.
Cause and effect diagram enables a user to hypothesize relationships between potential causes and of an outcome.
Influence diagram are another tool to conceptualize relationships with business performance relationships.
Example –
A restaurant customer dines 6 times a year and spends an average of $50 per visit. The restaurant realizes a 40% margin on the average bill for food and drinks.
Annual gross profit on a customer = $50(6)(0.40) = $120
30% of customers do not return each year. Average lifetime of a customer = 1/.3 = 3.33 years.
Average gross profit for a customer = $120(3.33) = $400
OR Average gross profit for a customer = $120/.3 = $400
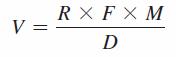
Thus, the economic value of a customer is
- V = value of a loyal customer
- R = revenue per purchase
- F = purchase frequency (number visits per year)
- M = gross profit margin
- D = defection rate (proportion customers not returning each year)
