Liquidity Ratios measure the ability of the firm to meet current / short-term obligations. They establish a relationship between cash and other current assets to current obligations. A firm should strike a proper balance between high liquidity with more cash balance (which means less profitability) and low liquidity (with problems of failure to meet obligations etc.)
Liquidity Ratios include (i) Current Ratio, (ii) Liquid or Acid Test Ratio or Quick Ratio, (iii) Cash Ratio or Absolute Liquid Ratio, (iv) Defensive-interval Ratio
Current Ratio: Current Ratio establishes relationship between the current assets and current liabilities and measures the ability of the firm to meet current liabilities.
Current Ratio = Current Assets / Current Liabilities
This ratio indicates the rupees of current assets available for each rupee of current liability / obligation. The higher the ratio, larger is the ability to meet current obligations and greater is the safety of funds of short-term creditors. Depending upon the industry the ratio may vary between 1.5 to 3.5 though the rule of thumb is 2.
Liquid Ratio or Acid Test Ratio or Quick Ratio: Liquid Ratio measures the ability to meet the current liabilities from the current assets which are readily or quickly convertible into cash (Current Assets less Inventory & Pre-paid expenses). Inventory is not readily convertible into cash and hence to be excluded.
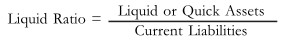
It is called Acid Test Ratio since it is more severe and stringent test. Rule of thumb is 1.
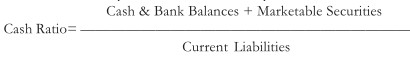
Cash Ratio / Absolute Liquid Ratio: Absolute Liquid Assets are considered here. Receivables have doubts about their realisability in time and hence they are excluded here.
Defensive-internal Ratio This ratio measures the ability to meet projected daily operating expenditure
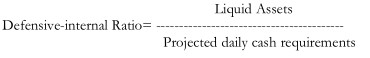
Where,
Projected Cash Operating Expenditure may be ascertained by adding Cost of goods sold + Selling & administrative and other cash expenses less depreciation & other non-cash expenditure. The resultant figure will be in number of days.
Leverage / Capital Structure Ratio
The process of magnifying the shareholders’ return through the employment of debt is called “Financial Leverage” or “Trading on Equity”. These ratios are called as financial ratios also. Leverage Ratios which are used to ascertain long-term solvency of a firm have two aspects:
- Debt Repaying capacity measured through Structural Ratios
- Interest paying capacity measured through Coverage Ratios
Structural Ratio
These ratios examine the soundness of the capital structure
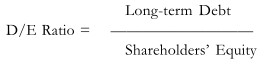
Debt-Equity Ratio
This ratio indicates the relative proportions of debt and equity in financing & claims against the assets of the firm.
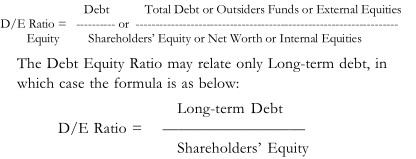
The Debt Equity Ratio may relate only Long-term debt, in which case the formula is as below:
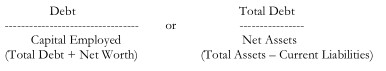
Debt to Total Assets
The Proportion of the assets that are financed with debt is indicated by this ratio
Debt / Total Assets
Debt to Capitalization Ratio
This is a link between the outsider’s long-term debt and long-term funds in the firm.
Proprietary Ratio
The Proportion of Total Assets financed by owners is indicated by this ratio.
Net Worth / Total Assets
Capital Gearing Ratio
Net Worth / Fixed income bearing funds (debentures, preference capital, loans)
Coverage Ratios
These Ratios measure the ability of the firm to cover or meet the obligations of paying interest on its debt. They reflect the ability of the firm to service the claims of long-term creditors.
Interest Coverage Ratio / Debt Service Ratio
It measures the debt servicing capacity of the firm.
Interest Coverage = Earnings Before Interest & Taxes (EBIT) /Interest
Since taxes are calculated after interest, the earnings before taxes is taken. Since the resultant figure gives the number of times interest covered by the EBIT, it is also known as ‘Times interest earned ratio’.
From the point of view of creditors, the larger the ratio, more assured is the payment of interest. For the firm a too high ratio means that the firm is too conservative in using debt and not using credit to the best advantage of shareholders. On the contrary, low ratio is a dangerous indication of excessive debt and not able to assure payment of interest to creditors.
Cash Flow Coverage
Cash Flow Coverage Ratio is used for relating cash Resources to the fixed financial obligations.
Cash Flow Coverage Ratio = Operating Cash Flows / Total Debt
Cash flow coverage ratio = (Net Earnings + Depreciation + Amortization) / Total Debt
