Linear regression analysis is a forecasting technique that establishes a relationship between variables. One variable is known or assumed, and used to forecast the value of an unknown variable. Past data establishes a functional relationship between the two variables. We will consider the simplest regression situation between the two variables and the linear relationship. Our forecast of the period’s demand is expressed by:
Ft=a + bX1
Where F1 is the forecast for the period t, given we know the value of the variable X in the period t. The coefficients a and b are constants: a is the intercept value for the vertical (F) axis and b is the slope of the line. Often the equation is expressed as:
Y=a + bX.
In this equation we have substituted F for Y, to indicate b is the forecasted value. In order to find coefficients a and b, old demand is utilized rather than the old forecast. These coefficients are computed by the following two equations
b=: a ($X1D1)-($X1)($D1)___
n ($X1*$X1)-($X1)($X1)
a=$D1- b & X1
n
Where D = a + bX, and a= no. of periods
Example: A pepperbox company carryout pizza boxes. The operation planning department knows that the pizza sales of major client are a function of the advertisement amount, the client spends, on account of which they receive in advance of the expenditure. Operation planning is interested in determining the relationship the client’s advertisement and sales. The amount of pizza the client would order. In money value is known to be a fixed percentage of sales
Quarterly advertising and sales
| Quarter | Advertising (in 1,00,000 Rs.) | Sales (in 1, 00,000 Rs.) |
| 1 2 3 4 5 6 7 8 9 10 | 4 10 15 12 8 16 5 7 9 102 | 1 4 5 4 3 4 2 1 4 |
Computing b and a, where advertising is X1 for the quarter t, sales are D1 for the quarter t and forecast is F1 for the future Period t
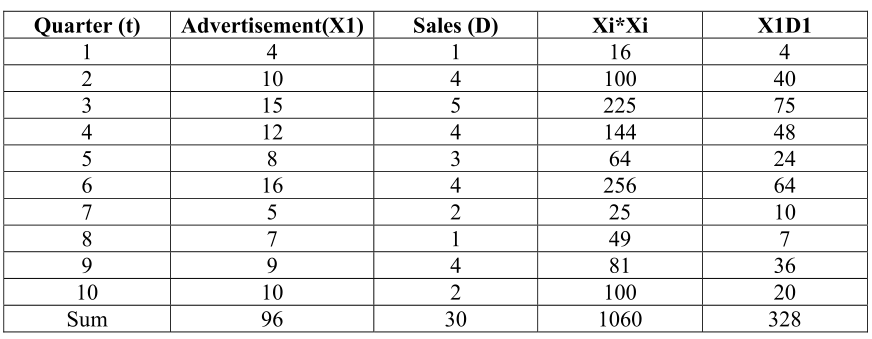
b = 10(328) – (96)30 =29
10(1060) -96*96
a = 30- .29(96) = .22
10
Thus the estimated regression line, the relationship between future sales F, and advertising X is
F=22+.29X
The operation planner can now ask for planned expenditure expenditures, and from that sales can be forecast
