Lean organizations have a customer-focused strategy which focuses on identifying and exploiting changes in market and competitive advantage. They have flexible structures which encourage individual initiative and feedback path to pinpoint defects, errors, and deficiencies. It concerns with standardized work and having strength in problem identification and resolution.
The Lean Process
Lean manufacturing is not just usage of few techniques or processes but a journey in itself which takes a holistic view of the organization and involves various phases which make use of various techniques and processes. The process for lean manufacturing involves following steps
- Define value from the customer’s perspective
- Map the value stream
- Create flow by removing causes of waste
- Create pull if flow is difficult to achieve
- Measure and validate
- Practice continuous improvements
Mudas or Waste
The core philosophy of lean manufacturing is waste elimination. The focus is not quick or more production but, to eliminate waste of any kind which has no value addition. Companies by focusing and following the philosophy of “do it faster, do it better” hide the symptoms of problems which hamper quicker and better production. Lean manufacturing reduces costs and increase productivity by addressing the root of the problem by eliminating the “muda”.
Muda is a Japanese term meaning “waste” as, lean manufacturing is an Japanese management philosophy hence, Japanese terms and concepts are used extensively. There are 7 mudas or seven types of waste that are found in a manufacturing process which are
- Overproduction – An protective or “just in case” mindset usually results in overproduction. Producing more than the customer requires is waste. It causes other wastes like inventory costs, manpower and conveyance to deal with excess product, consumption of raw materials and installation of excess capacity.
- Needless Inventory – Inventory at any point is a no value-add as it ties up financial resources of the company and is exposed to the risk of damage, obsolescence, spoilage, and quality issues. It also needs space and other resources for proper management and tracking. Large inventories also cover up process deficiencies like equipment problems or poor work practices.
- Defects – Defects and broken equipment results in defective products and subsequently customer dissatisfaction, which need more resources for solving. Shipping damage is also taken as a defect. Any process, product, or service that fails to meet specifications is also a waste.
- Non-value Processing – It is also called over-processing, for which more resources are wasted in production, their wasted movement and time. Any processing that does not add value to the product is waste like in-process protective packaging. It is primarily due to extra or unnecessary manufacturing steps, using older and outdated methods or not having standard work plans.
- Excess Motion – Unnecessary motion which is also a waste occurs due to poor workflow, poor layout, housekeeping, inconsistent and undocumented work methods or lack of standardized procedures or even a deficiency in employee training. It is usually hidden as it’s not easily evident, but careful observation and worker’s communication can highlight it.
- Transport and Handling – It focus on shipping damage and includes pallets not being properly stretch wrapped (wasted material), or a truck is not loaded to use floor space efficiently or in handling, setting up or fixing a wrapping machine. Material should be shipped directly from the vendor to the location in the assembly line where it will be used also called as point-of-use-storage (POUS).
- Waiting – These are wastages in time, usually due to broken machinery, lack of trained staff, shortages of materials, inefficient planning, and waiting for material, information, equipment, tools, etc. It leads to slowed production, delayed shipments, and even missed deadlines.
There are other types of waste in other places which are
- Confusion – It is due to misinformation
- Underutilization of available employees (of their skills and knowledge ) and facilities
Elimination of these wastes is discussed next though it can be a long and difficult task, but the results of improved productivity and profits are what it aims for.
Value Stream Mapping
Value Stream Mapping (VSM) is a visualization tool oriented to understand and streamline work processes using icons and symbols to depict various elements and improve the flow of material and information. It helps in identifying and decreasing waste or non-value addition, in the process. It can also be used as a strategic planning tool and a change management tool other than a communication tool.
Metrics – VSM visually maps processes, end to end from receipt as raw material to steps involved in manufacturing process and delivery as finished product thus, mapping of process from an external supplier to external customer. It maps various metrics which include
- Cycle Time
- Down Time
- Lead Time
- % Complete and Accurate
- In-process inventory
- Information flow paths, etc.
It visualizes the current state of the process activities and guides towards the future desired state by making a present state and future state value stream.
Process – VSM involves creation of a mapping team which has representation from all the different functions and specialties, so as to gain a common understanding of the process and not only develop but also implement good solutions.
Application – VSM is more suitable to companies having high-production, low-variety product mixes with few components and subassemblies and dedicated equipment.
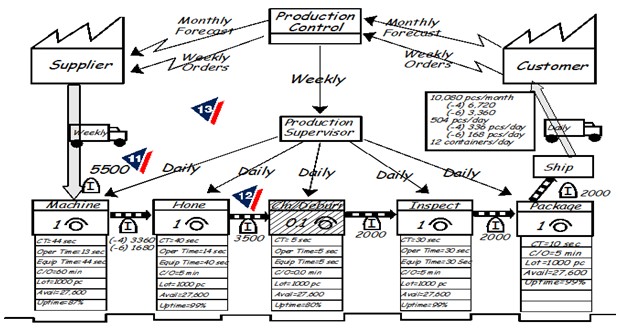
Present State Mapping – It is the process to create a Present State Map, which shows work processes as they currently are. It is needed to pinpoint change and know where opportunities for improvements are present.
Future State Mapping – It is the process of creating a Future State Map which is the desired state with removal of non-value processes and is quality conscious along with being flexible. It is needed to not only create a blueprint for improvements but also put forward an objective for the organization to achieve for better work flow and discarding non-value processes.
VSM Primary Icons
These icons are essential for mapping and development of VSM. They include
| Icon | Name | Description |
 | Customer/Supplier | It represents outside sources. It represents the supplier when placed in the upper-left, and the customer when placed in the upper-right. |
 | Process | It is a process box with operator. The process or activity name is listed in the top bar, and the department or function name in the center area. It may represent a process, operation, department, or other activity involved in material flows. |
 | Production Control | It is a process box; an area where value can be added to a product. The process or activity name is listed in the top bar, and the department or function name in the center area. It is a shared process operation or department. It includes estimates for the number of operators required, for the value stream. |
 | Process Box with Information Technology | Process or activity name in the top bar, Department or function name in the center area. Note the information technology used to assist in the processing of information in the lower-left corner. If largely or completely manual, may indicate “manual” or “manual” plus the information technology used. |
 | Data Table | This data box is placed under other icons that have information required for analyzing the system. It typically includes Cycle Time (Process Time, Lead Time), Changeover Time, and other processing information. |
| | Information Box | Text box for including relevant information only as needed. |
| | Physical Pull | This is a withdrawal of materials from a supermarket. |
 | Shipment Truck | This represents shipments using external transport from a supplier. It may be labeled with the frequency of shipment. |
 | Inventory | This is a material Queue of products that are not being processed. It represents storage of raw materials as well as finished goods. The time period may be listed below the icon. |
| | Push Arrow | It represents a push of information or material from one process to another. A process produces something regardless of the downstream needs. |
| | Manual Information | This arrow indicates manual flow of information. |
| | Electronic Information | This shape represents electronic flow of information. |
| | Pull Arrow | This indicates that a customer or process pulls from a previous process. |
 | Shipment or Materials Movement Arrow | This represents material or product flow from supplier to process or from process to customer. Supplier to process flow top to bottom; process to customer flows bottom to top. |
VSM Secondary Icons
These are icons and symbols which are optional for mapping and development of present and future state VSM. They include
| Icon | Name | Description |
| | Production Kanban | This is a visual signal representing a trigger of production of a specific number of parts. |
 | Batch Kanban | This indicates batch processing. |
 | Batch Withdrawal Kanban | This is a card or device that instructs a handler or operator to withdraw items via batch processing from a supermarket. |
| | Withdrawal Kanban | This is a card or device that instructs a handler or operator to withdraw items from a supermarket. |
 | Database | A database. |
 | Supermarket | This is an inventory “supermarket” that contains some inventory available to downstream customers enabling them to select what they need. The next process or customer would pull from this inventory. |
| | FIFO Lane | This represents a First In, First Out Sequence Flow. |
 | Inventory/In-box | An in-box is an information queue. It indicates inventory. Inventory is usually paperwork or electronic files. If there is a cost ($ value) listed below the symbol, it represents the scheduling priority. Inventory examples Forms in people’s in- boxes Work stored in e-mails (message, requests for information, files) Design projects in queue |
 | Operator | This is the symbol for a worker. It is added to a process box to indicate a worker completes some or all of the process tasks. |
 | Multiple Operators | This symbol and number represents the number of workers involved. Percentage of time to perform the specific process may be noted in parentheses to the right of the number of workers. |
| | Load Leveling | It batches kanbans to level mix or volume. |
 | Phone | This represents collecting information via telephone. |
 | Kaizen Burst | This highlights improvement needs at a specific process that is critical to achieving the future state map. |
 | Go See Scheduling | Glasses represent collecting information visually. It can also indicate informal Scheduling. |
 | Kanban Post | This represents a location for kanban signal pickup. |
| | Pull Arrow | This indicates that a customer or process pulls from a previous process. |
 | Safety/Buffer Stock | This is an inventory stock reserved for specific circumstances. |
| | Sequenced Pull Ball | It represents a pull system that gives instruction to other processes to produce a predetermined type and quantity of product without using a supermarket. |
 | Signal Kanban | It is used to alert when the inventory levels in the supermarket between two processes drops to a trigger or minimum point. |
| | Timeline Segment | A timeline segment shows value-added times and non-value-added times. Value-added times are cycle processing times, and non-value-added times are wait times. |
 | Clock | A clock icon indicates a delay or timing constraints. |
 | Rework | This indicates multiple iterations or a need for rework. |
Developing the VSM
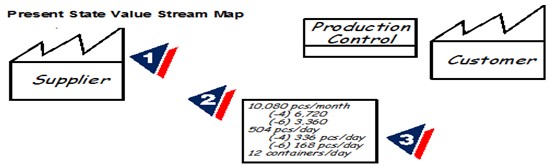
Even though the VSMs are complex on observation but, their construction is easy when taken in logical steps. VSM mapping involves step by step development of the VSM state map whether a present or of future state map. In this section, preparation of a present state VSM is detailed
Step 1 – Draw customer, supplier and production control icons.
Step 2 – Enter customer requirements.
Step 3 – Calculate daily production required.
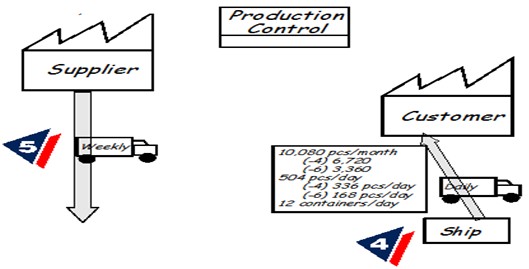
Step 4 – Draw outbound shipping icon and truck with delivery frequency.
Step 5 – Draw inbound shipping icon, truck and delivery frequency.
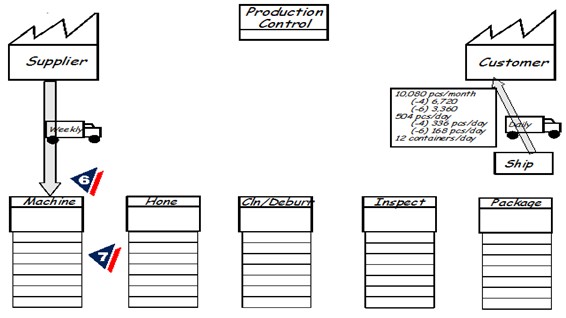
Step 6 – Add process boxes, in sequence, left to right.
Step 7 – Add data boxes below.
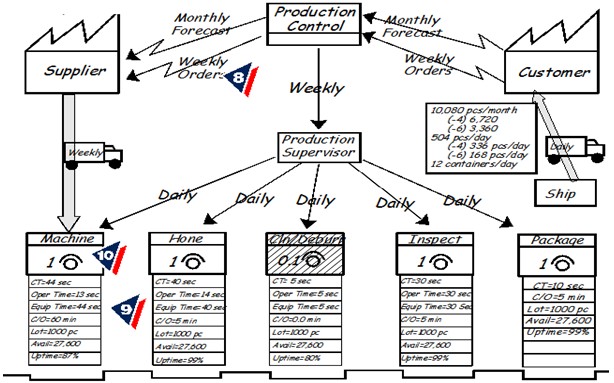
Step 8 – Add communication arrows with methods and frequencies.
Step 9 – Obtain process attributes. Add to data boxes.
Step 10 – Add operator symbols.
Step 11 – Add inventory locations and levels in days of demand graph at bottom.
Step 12 – Add push, pull and FIFO icons.
Step 13 – Add other useful information.
Step 14 – Add working hours.
Step 15 – Add cycle times (CT) and lead times.
Step 16 – Calculate total cycle lead time.
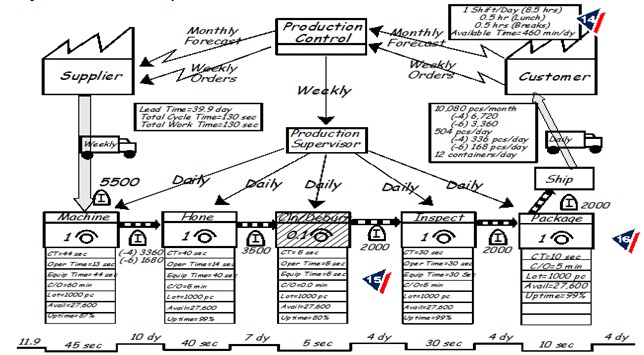
Cycle Time (CT) is the time taken to complete the corresponding process. Changeover Over Time (C/O) is the time involved for changing from one model to another. Uptime (UT) is the actual operating time divided by available time and with changeover time it is calculated as
UT = (AT-C/O)/AT
5S
5S are the principles of work environment improvement. Companies usually initiate with 5S, for their lean manufacturing program. Five S is a manageable process which people easily grasp and adapt to it. This technique focuses on standardized cleanup of the workplace but, involves much more than that.
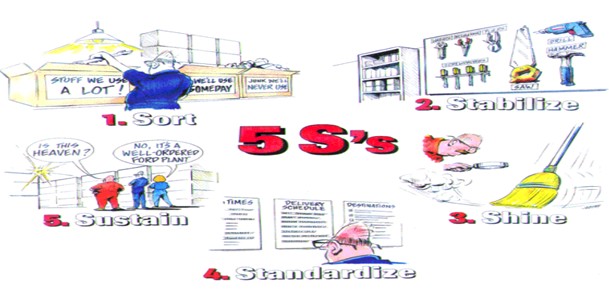
Five S is a method to organize and manage the workspace and work flow for improving efficiency by eliminating waste, improving work flow and reducing process inefficiencies. Five S is a reference to five Japanese words that have been translated into English. The 5S’s are, Sort (Seiri), Straighten (Seiton), Sweep (Seiso), Standardize (Seiketsu) and Sustain (Shitsuke).
5S Stages
Cleanliness and order are important issues in a manufacturing or processing environment. The core idea is to increase productivity, improve the level of quality and raise work ethic which is reached when the working environment is clean and in good order. 5S is a practical tool for maintaining these as, it helps to find and eliminate issues in time. The 5S-model is flexible as it can be applied in to an office as well as in the production environment of a company for developing systematic and disciplined operations.
The employee’s workstation is an important part in the employees’ daily life which should be clean, in good order and safe. 5S also focuses on making it an efficient and comfortable as well. Employees must be at ease to simplify processes resulting in fewer accidents, low rejection or discards, waste running, stoppages and mistakes. The various stages are discussed as
Phase 1 – Sort (Seiri)
The first phase is called Sort and it focuses on to sort everything. Every tool, object and instrument is noted and their demands are evaluated. This phase also includes a task of criteria creation which, differentiate amongst useful and useless products. Removable products are sorted and disposed later on. Useful products are sorted and places are created for them after sorting.
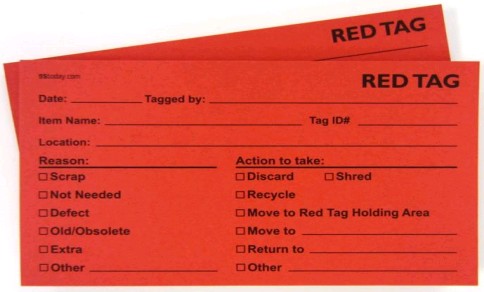
Most used method in sorting is the “Red-tag”-program in which the removable products are marked with a red tag as in the figure below. The tag has information on name of the inspector, date, demand, reason of the tag, storage place and disposition date. Jigs, moulds, junk and work-in process items are used stored all over the workplace and this phase gets rid of all these by moving the tagged products into red tag-area and after that, either positioned again or disposed off.
Removing useless items clears working environment and adds more space to act. This phase also helps to keep places clean and in good order. Moving and safety at work gets better by saving and increasing space and clarifying processes. The sorting should be conducted on a daily, weekly and monthly manner depending upon the requirement. The idea is to ensure that everything left in the workplace is related to work and even necessary items are absolute minimum.
Phase 2 – Set in Order (Seiton)
This phase finds storage space for every needed tool or instrument and the spaces are properly marked. The organization of the storage space is in a way so that those can be found easily when needed. Setting in order also ensures finding the item by anyone else also easy and placing back at marked space. This marking remove useless searching, improves safety at work and make working environment better. Tools and wires are also marked or color coded for easy access and usage. Marking off the floor and dividing it into stations is also undertaken to make passages and simplify movements in the production areas. When pulling the lines, it is useful to mark places for pallets, pallet jacks and garbage cans at the same time. Color-codes and signs are used to prevent equipments getting mixed-up.
Time used into taking something to its own place or getting it, is pointless when thinking from works point of view. Because of that, pointing places is critical. Belongings needed rarely are moved beyond and equipments needed daily are staying near the stations. If everyone has quick access to an item or materials, work flow becomes efficient, and the worker becomes productive. The correct place, position, or holder for every tool, item, or material must be chosen carefully in relation to how the work will be performed and who will use them.
Phase 3 – Shine (Seiso)
The first and second phase address issues related to space but dirt which is present everywhere, is addressed by the third phase. Dirt wear down machines and makes quality worse. Seiso focuses on cleaning up everything. Floors, tools, tool racks, devices and especially machines are cleaned of dirt. Machinery life increases and everything is ready in top condition for use when needed. This results in user maintenance and making it easier to identify possible errors and deviations. Seiso consists of cleaning up the workplace and giving it a ‘shine’. Everyone should see the ‘workplace’ through the eyes of a visitor – always thinking if it is clean enough to make a good impression.
Clean environment creates optimal working environment as, everybody watches out mistakes and from the other hand, even the smallest mistakes are easier to register. Oily and dirty floors can cause slips and objects in wrong places can be fatal which are addressed in this phase. Cleanliness manual or instructions should be created for maintaining it.
Phase 4 – Standardize (Seiketsu)
Without daily discipline and clear follow-up and operation routines it is too easy to return into old habits and fall back to inefficiencies. This phase centers on standardization by emphasizing creation of procedures and routines. The purpose of this phase is to use and maintain what was achieved in earlier three phases (sorting, stabilizing and shining ) into continuous and developing course of actions. By creating the methods into standards, employees are expected to obey them. Mundane tasks are established and are followed precisely. Instructions should be clear and easy to understand so that anyone could check the workstation with the help of those.
It consists of defining the standards by which personnel must measure and maintain ‘cleanliness’. Seiketsu encompasses both personal and environmental cleanliness and starts with personal tidiness. Visual management is an important ingredient of seiketsu. Color-coding and standardized coloration of surroundings are used for easier visual identification of anomalies in the surroundings. Check lists are created in standardization phase which also helps in monitoring of the level of operation model.
Phase 5 – Sustain (Shitsuke)
Shitsuke, means ‘Discipline’ and denotes commitment to maintain orderliness and to practice the first 4S as a way of life. The emphasis of shitsuke is elimination of bad habits and constant practice of good ones. Once true shitsuke is achieved, personnel voluntarily observe cleanliness and orderliness at all times, without having to be reminded. Sustaining the progress as in this phase, enables method becoming a part of daily actions and development. Creating competition amongst departments can also motivate the employees and as well as help in sustenance.
Internal audit lists are created in this phase and conducted at regular intervals. The results of audits are gathered and put on to bulletin boards so that everyone can see and follow up the development of 5S-actions. Evaluation should include implemented changes and comparison to earlier months. Audit is essential tool in progress of pushing cleanliness and sustaining a creditable level of order.
5S-operation model brings many benefits which are economical and improvement of human resource. The main benefits are summarized as
- Upgrade of productivity and the quality of actions
- Reduce of work in-processes and shorten lead-times
- Better working circumstances and rising comfort
- Decreasing searching times and costs
- Rising company image
5S results in better identification of problems and deviations before major complication appear. If audits points to error or deviation in the same machine or station, it highlights the problem before anything major occurs due to it. Even the smallest blips be acted upon by reaching to the roots of the problem and eliminated.
Kaizen
Kaizen (Ky ‘zen) is a Japanese term which means continuous improvement as the words ‘Kai’, means continuous and ‘zen’ means improvement. Sometimes Kaizen also translates to ‘Kai’ to mean change and ‘zen’ to mean good, or for the better.
Introduction
Kaizen is a system which involves every employee of the organization whether from senior management or the lowest rank employee. Everyone is encouraged to come up with small improvement suggestions on a regular basis or it is continuous and not limited to monthly or yearly activity. Companies, who have implemented Kaizen, receive 60 to 70 suggestions per employee per year which are written down, shared and implemented.
In most cases the ideas are not for major changes as, Kaizen focus on making little changes of improving productivity, safety and effectiveness while reducing waste on a regular basis. Suggestions are also not limited to a specific area like production or marketing but changes can be made anywhere needing improvements. The Kaizen philosophy is to “do it better, make it better, and improve it even if it isn’t broken, because if we don’t, we can’t compete with those who do.”
Kaizen encompasses many continuous improvement components like Quality circles, automation, suggestion systems, just-in-time delivery, Kanban and 5S. Kaizen involves setting standards and then continually improving those standards with providing needed training to achieve the standards and maintain them on an on-going basis.
Gemba – Gemba is a Japanese word for ‘real place,’ where the value-adding activities to satisfy the customer are carried out. The Gemba place can be where the product is developed or produced or sold or made. In the service sectors, Gemba is where the customers come into contact with the services offered. Gemba is important to Kaizen as most managers prefer their desk thus, come in contact with reality only through reports or other meetings.
Gembutsu¸ is a Japanese word meaning some unconformable physical or tangible things like out of order equipment or scrap which can be felt. If a machine is down or a complaining client, the machine itself is gembutsu then, go to Gemba and have a good look at the machine. By looking at the machine, and asking the question “why” several times, to probably find out the reason for the breakdown on the spot.
Kaizen Steps
Kaizen process follow the below listed steps
- Define the problem – Defining the problem is a first activity to undertake for initiating the Kaizen process.
- Gemba walk and Document the current situation – It involves making observation and conducting meetings so as to gather information and identify inefficiencies in the present processes especially where the Gemba is or the places where value process are taking place.
- Visualize the ideal situation – Develop a ideal blueprint for the future situation which is achievable by implementing Kaizen
- Define measurement targets – After finalization of the blueprint for the ideal solution to the present inefficiencies, make measurable targets so as to quantify the gains due to Kaizen implementation.
- Brainstorm solutions to the problem – Brainstorming helps in listing possible the solutions whose implementation will
- Develop Kaizen plan
- Implement plan
- Measure, record and compare results to targets
- Prepare summary documents
- Create short term action plan, on-going standards and sustaining plan
