
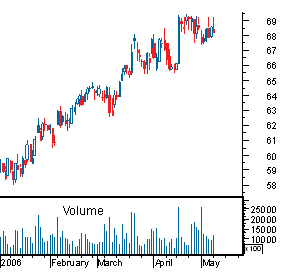
Volume refers to the amount of shares or bonds traded over a span of time, generally a day. Higher volume of a security indicates the more active the security is. In order to determine the movement of the volume, the volume bars should be referred that are usually found at the bottom of any chart where the volume bars demonstrates the number of shares that have been traded per period and illustrates the trends in the same way that prices do. Following is a figure displaying volume bars,


Apply for Technical Analysis Certification Now!!
http://www.vskills.in/certification/Certified-Technical-Analyst