R has many facilities for producing high quality graphics. A useful facility before beginning is to divide a page into smaller pieces so that more than one figure can be displayed. For example:
> par(mfrow=c(2,2))
creates a window of graphics with 2 rows and 2 columns. With this choice the windows are filled up row-wise. Use mfcol instead of mfrow to fill up column-wise. The function par is a general function for setting graphical parameters.
So, for example
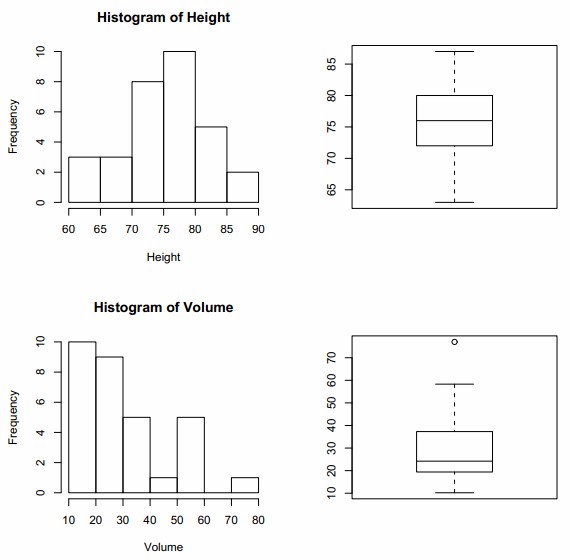
> par(mfrow=c(2,2))
> hist(Height)
> boxplot(Height)
> hist(Volume)
> boxplot(Volume)
> par(mfrow=c(1,1))
produces below figure. Note the final use of par to return the graphics window to standard size.
We can also plot one variable against another using the function plot:
> plot(Height,Volume)
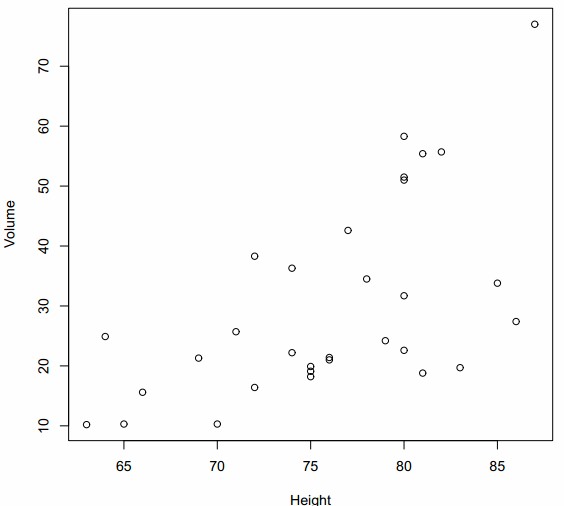
Like many other functions plot is object-specific: its behaviour depends on the object to which it is applied. For example, if the object is a matrix, plot is identical to pairs: try plot(trees). For some other possibilities try:
> data(nhtemp)
> plot(nhtemp)
> data(faithful)
> plot(faithful)
> data(HairEyeColor)
> plot(HairEyeColor)
There are also many optional arguments in most plotting functions that can be used to control colours, plotting characters, axis labels, titles etc. The functions points and lines are useful for adding points and lines respectively to a current graph. The function abline is useful for adding a line with specified intercept and slope.
To print a graph, point the cursor over the graphics window and press the right button on the mouse. This should open up a menu which includes `print’ as an option. You also have the option to save the figure in various formats, for example as a postscript file, for storage and later use.
