Forecast based on analyzing the product life cycle and the demands of similar past products with the assumption that it follows similar patterns. It is often difficult to locate recently introduced products that share similar product life-cycle traits and characters.
Forecast by analogy is a forecasting method that assumes that two different kinds of phenomena share the same model of behaviour. For example, one way to predict the sales of a new product is to choose an existing product which “looks like” the new product in terms of the expected demand pattern for sales of the product
Used with care, an analogy is a form of scientific model that can be used to analyze and explain the behavior of other phenomena. According some experts, research has shown that the careful application of analogies improves the accuracy of the forecast.
Delphi Method
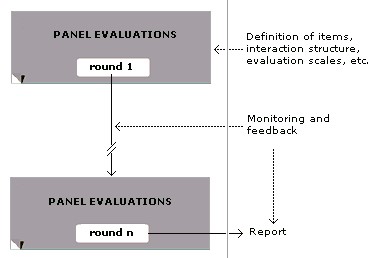
The Delphi method is a structured communication technique, originally developed as a systematic, interactive forecasting method which relies on a panel of experts. The experts answer questionnaires in two or more rounds. After each round, a facilitator provides an anonymous summary of the experts’ forecasts from the previous round as well as the reasons they provided for their judgments.
The anonymous aggregated responses are shared after each round to allow them to adjust their answers in subsequent rounds until they are able to reach their final response through consensus. As in most judgmental forecasting, the Delphi method also has it difficulties. The time required to complete this method is long and finding the right mix of industry experts and keeping them involved throughout the product life-cycle is hard.
Delphi is based on the principle that forecasts (or decisions) from a structured group of individuals are more accurate than those from unstructured groups. The technique can also be adapted for use in face-to-face meetings, and is then called mini-Delphi or Estimate-Talk-Estimate (ETE). Delphi has been widely used for business forecasting and has certain advantages over another structured forecasting approach, prediction markets.
The Delphi Method communication structure
Key characteristics – The following key characteristics of the Delphi method help the participants to focus on the issues at hand and separate Delphi from other methodologies
- Anonymity of the participants – Usually all participants remains anonymous. Their identity is not revealed, even after the completion of the final report. This prevents the authority, personality, or reputation of some participants from dominating others in the process.
- Structuring of information flow – The initial contributions from the experts are collected in the form of answers to questionnaires and their comments to these answers. The panel director controls the interactions among the participants by processing the information and filtering out irrelevant content. This avoids the negative effects of face-to-face panel discussions and solves the usual problems of group dynamics.
- Regular feedback – Participants comment on their own forecasts, the responses of others and on the progress of the panel as a whole. At any moment they can revise their earlier statements. While in regular group meetings participants tend to stick to previously stated opinions and often conform too much to the group leader; the Delphi method prevents it.
- Role of the facilitator – The person coordinating the Delphi method is usually known as a facilitator or Leader, and facilitates the responses of their panel of experts, who are selected for a reason, usually that they hold knowledge on an opinion or view.
Time series methods use historical data as the basis of estimating future outcomes.
Moving Average
A moving average (rolling average or running average) is a calculation to analyze data points by creating a series of averages of different subsets of the full data set. It is also called a moving mean (MM) or rolling mean and is a type of finite impulse response filter. Variations include: simple, and cumulative, or weighted forms (described below).
A moving average is commonly used with time series data to smooth out short-term fluctuations and highlight longer-term trends or cycles. The threshold between short-term and long-term depends on the application, and the parameters of the moving average will be set accordingly.
Exponential Smoothing
Exponential smoothing is a technique that can be applied to time series data, either to produce smoothed data for presentation, or to make forecasts. The time series data themselves are a sequence of observations. The observed phenomenon may be an essentially random process, or it may be an orderly, but noisy, process. Whereas in the simple moving average the past observations are weighted equally, exponential smoothing assigns exponentially decreasing weights over time.
Exponential smoothing is commonly applied to financial market and economic data, but it can be used with any discrete set of repeated measurements. The simplest form of exponential smoothing should be used only for data without any systematic trend or seasonal components
The raw data sequence is often represented by {xt} beginning at time t=0, and the output of the exponential smoothing algorithm is commonly written as {st}, which may be regarded as a best estimate of what the next value of x will be. When the sequence of observations begins at time t = 0, the simplest form of exponential smoothing is given by the formulae
where α is the smoothing factor, and 0 < α < 1.
Extrapolation
Extrapolation is the process of estimating, beyond the original observation range, the value of a variable on the basis of its relationship with another variable. It is similar to interpolation, which produces estimates between known observations, but extrapolation is subject to greater uncertainty and a higher risk of producing meaningless results. Extrapolation may also mean extension of a method, assuming similar methods will be applicable.
It is a statistical technique to aid interpretation of data. When a series of measurements of a process are treated as a time series, trend estimation can be used to make and justify statements about tendencies in the data, by relating the measurements to the times at which they occurred.
Growth Curve
A growth curve is an empirical model of the evolution of a quantity over time. Growth curves are widely used in biology for quantities such as population size or biomass (in population ecology and demography, for population growth analysis), individual body height or biomass (in physiology, for growth analysis of individuals). Values for the measured property can be plotted on a graph as a function of time; see figure for an example.
Growth curves are employed in many disciplines besides biology, particularly in statistics, which has an extensive literature on growth curves. In mathematical statistics, growth curves are often modeled as being continuous stochastic processes, e.g. as being sample paths that almost surely solve stochastic differential equations.
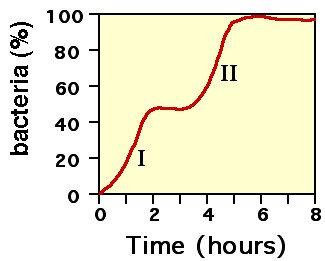
A bi-phasic bacterial growth curve.
Some forecasting methods try to identify the underlying factors that might influence the variable that is being forecast. For example, including information about climate patterns might improve the ability of a model to predict umbrella sales. Forecasting models often take account of regular seasonal variations. In addition to climate, such variations can also be due to holidays and customs: for example, one might predict that sales of college football apparel will be higher during the football season than during the off season.
Chain-ratio method
An estimation method used by multiplying a base number by a chain of related percentages. It is frequently used in marketing to estimate the size of a target market. It is a method of calculating total market demand for a product in which a base number, such as the total population of a country, is multiplied by several percentages, such as the number in the population above and below certain ages, the number in the population with an interest in motor sport, the number in the population with motor-cycle licences, in order to arrive at a rough estimate of the potential demand for a particular good or service (in this case, say, a new type of motor cycle helmet.
- End use method – This method forecasts the demand based on the consumption coefficient of the various uses of the product.
- Leading indicator method – This method uses the changes in the leading indicators to predict the changes in the lagging indicators.
- Econometric method – An advanced forecasting tool, it is a mathematical expression of economic relationships derived from economic theory.
The steps to forecasting are
- Analysing and understanding the problem – The manager must first identify the real problem for which the forecast is to be made. This will help the manager to fix the scope of forecasting.
- Developing sound foundation – The management can develop a sound foundation, for the future after considering available information, experience, type of business, and the rate of development.
- Collecting and analysing data – Data collection is time consuming. Only relevant data must be kept. Many statistical tools can be used to analyse the data.
- Estimating future events – The future events are estimated by using trend analysis. Trend analysis makes provision for some errors.
- Comparing results – The actual results are compared with the estimated results. If the actual results tally with the estimated results, there is nothing to worry. n case of any major difference between the actuals and the estimates, it is necessary to find out the reasons for poor performance.
- Follow up action – The forecasting process can be continuously improved and refined on the basis of past experience. Areas of weaknesses can be improved for the future forecasting. There must be regular feedback on past forecasting.
