It is used to develop a process map. A process map is a graphical representation of a process which displays the sequence of tasks using flowcharting symbols.
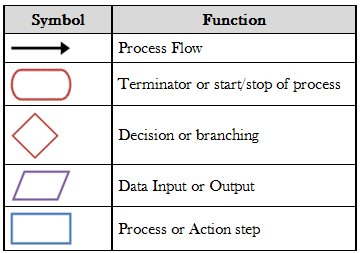
It shows the inputs, actions and outputs of a given system. Inputs are the factors of production like land, materials, labor, equipment, and management. Actions are the way in which the inputs are processed and value is added to the product like procedures, handling, storage, transportation, and processing. Outputs are the finished good or delivered service given to the customer but, output also includes un-planned and undesirable entities like scrap, rework, pollution, etc. Flowchart symbols are standardized by ANSI and common symbols used are
The flowchart shows a high-level view of a process view and it’s capability analysis. The flow chart can be made either more complex or less complex.
