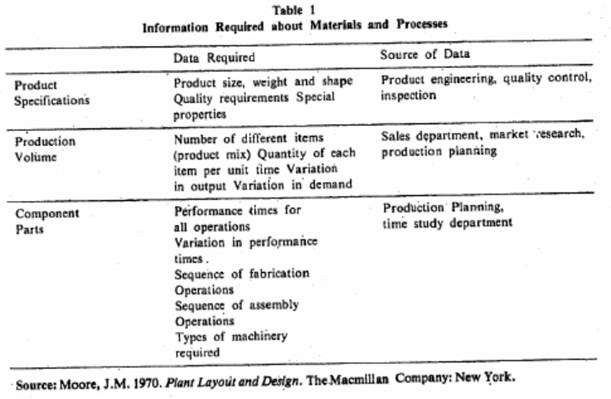
Data Collection
The development of any layout is dependent on the quality and quantity of facts that we have about the various factors influencing it. The data collection phase is not a onetime effort but an ongoing function. The data for overall plan is to be collected at initial stages whereas the data for detailed layouts may be obtained at a later stage. The facts have to be obtained regarding various materials and processes, the flow routing and sequencing, space requirements, and different activities and relationships. The information• required• about the materials and processes is listed in Table 1. We will now discuss some of the tools and techniques that help in the layout analysis.
Process Charts
There are many types of process charts that can be developed. The most commonly used ones are operation process charts and Flow Process Charts. ,
Operation Process Chart: This is a graphic representation that describes the different operations (O) and inspection ( ) in a sequential manner including information regarding time, location etc.
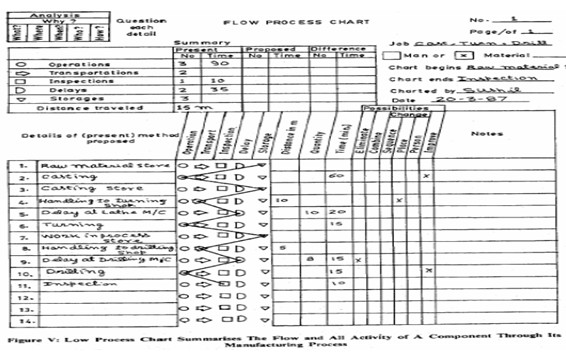
Flow Process Chart: The arrangement of fatalities in a production process governs the flow of product and vice-versa. Thus the analysis of flow should be carried out closely when formulating a plant layout proposal. The flow process, chart summarizes the flow and activity of a component/man through a process or procedure in terms of sequence of operation, transportation, inspection, delay and storage. It includes the information about time required and distance moved. A sample flow process chart is shown in Figure V.
Flow Diagram
It is a sketch of the layout which shows the location of all activities appearing on a flow process chart. The path of movement of material or man is traded on the flow, diagram. The different activities are given by process chart symbols with a number. This gives art idea about the overall flow through the plant in a pictorial manner. Any back tracking or crisis crossing of the flow can be pin-pointed and the layout engineer can redesign the layout for a smoother flow by minimizing these wasteful flows: If necessary a three dimensional flow diagram can be developed; particularly in case of multi storied buildings. This helps in the activity relationship diagram which when superimposed by space relationship results in block plan.
Travel Chart
It is also known as From To Chart. This chart is helpful in analyzing the overall material flow. It indicates the distance and number of moves between different pairs of departments taken as origin and destination. A typical travel chart is shown in Figure VI. The travel chart is helpful in the process type layout design; but in product layout, it is not important. It indicates the relationship between different departments in terms of material interaction. Attempts should be made in layout design to put those departments close to each other which have high level of material interaction so as to minimize the materials handling requirements provided other objectives are also satisfied. In most of the practical situations, it may be difficult to achieve the theoretical optimum, but the closest possible solution to the optimum should be approached.
The travel chart summarizes the data on material handling in compact matrix form, which is amenable to computer applications also. Further, the information regarding the bulk of material handled, mode of material handling, material handling equipment etc. may also be listed to make it more informative.
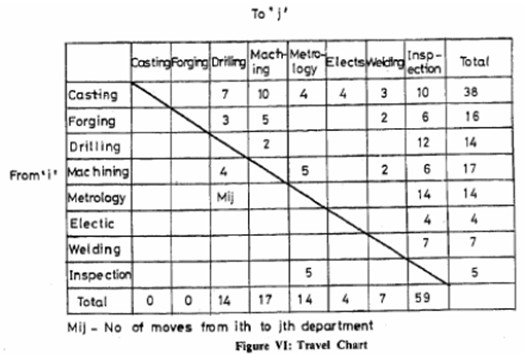
The entries in the travel chart are on both sides of the diagonal. The travel requirements from department `A’ to `B’ may be different than from department ‘B’ to ‘A’.
The sum of each row should be equal to the sum of each column indicating that the number of jobs entering to department and leaving the same department is equal. This puts a check on the continuity of the system. However, this is not true the first and last departments in the sequence. The addition of the first and last row should balance with the addition of first and last column.
Some of the important advantages and uses of travel chart are:
- It helps in analyzing the material movement
- It aids in determining activity locations
- It alternates flow patterns and layouts can be compared
- It shows relationship of different activities in terms of volume of movement.
- It depicts quantitative relationships which can be used for computerized analysis and OR applications.
REL Chart
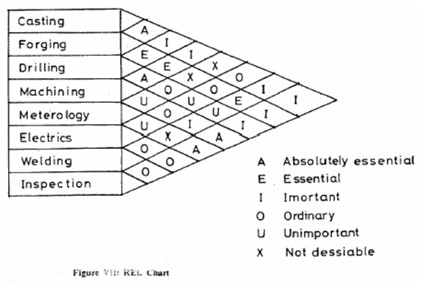
This is known as `Relationship Chart’ which indicates the relationship between pairs of departments in terms of closeness depending upon the activities of the department as A-Absolutely essential, E-Essential, I-Important, 0-Ordinary, U-Unimportant and X-Undesirable. A typical REL chart is shown in Figure VII.
Application of Quantitative Techniques
The techniques of Operations Research can be applied to quantitatively analyze the layout problems, particular!”. in terms of material flow. Some of the important, techniques that have been applied by different researchers in the field of layout planning are as follows:
- Linear Programming
- Transportation Algorithm
- Transshipment Problem
- Assignment Problem
- Traveling Salesman Problem
- Programming
- Queuing Theory
Linear Programming is used when there is a linear objective function which is to be maximized/minimized subject lo certain linear constraints. In the layout design the objective is to minimize the Materials handling. ‘Transportation and assignment problems are special cases of Linear Programming. Further, to meet the multiple objectives of layout planning attempts have also been made to apply Goal Programming as a technique of Multi-criteria Decision-making. These operation’s research techniques are discussed in MS. 7
