Economic Order Quantity( EOQ)
Economic order quantity (EOQ) is the ideal order quantity a company should purchase for its inventory given a set cost of production, demand rate and other variables. This is done to minimize variable inventory costs, and the equation for EOQ takes into account storage, ordering costs and shortage costs. The full equation is:
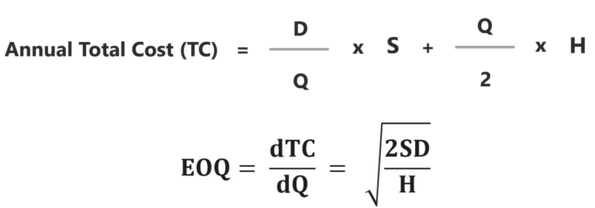
EOQ = √(2SD / H), or the square root of (2 x S x D / H).
S = Setup costs (per order, generally includes shipping and handling)
D = Demand rate (quantity sold per year)
H = Holding costs (per year, per unit)
This formula is derived from the cost function – Total cost = purchase cost + ordering cost + holding cost
Limitations of the economic order quantity model, requires that the application of EOQ order that the demands remain constant throughout the year. It is also necessary that the inventory be delivered in full when the inventory levels reach zero.
Assumptions
Underlying assumption of the EOQ model – Following are the underlying assumptions for the EOQ model. Without these assumptions, the EOQ model cannot work to its optimal potential.
- The cost of the ordering remains constant.
- The demand rate for the year is known and evenly spread throughout the year.
- The lead time is not fluctuating (lead time is the latency time it takes a process to initiate and complete).
- No cash or settlement discounts are available, and the purchase price is constant for every item.
- The optimal plan is calculated for only one product.
- There is no delay in the replenishment of the stock, and the order is delivered in the quantity that was demanded, i.e. in whole batch.
Ordering Cost
The number of orders that occur annually can be found by dividing the annual demand by the volume per order. The formula can be expressed as: Number of orders = D / Q
For each order with a fixed cost that is independent of the number of units, S, the annual ordering cost is found by multiplying the number of orders by this fixed cost. It is expressed as:
Annual Ordering Cost = D/Q x S
Holding Cost
Holding inventory often comes with its own costs. This cost can be in the form of direct costs incurred by financing the storage of said inventory or the opportunity cost of holding inventory instead of investing the money tied up in inventory elsewhere. As such, the holding cost per unit is often expressed as the cost per unit multiplied by the interest rate, expressed as – H = iC
With the assumption that demand is constant, the quantity of stock can be seen to be depleting at a constant rate over time. When inventory reaches zero, an order is placed and replenishes inventory.
As such, the holding cost of the inventory is calculated by finding the sum product of the inventory at any instant and the holding cost per unit. It is expressed as
Annual Holding Cost = Q / 2 x H
Safety Stock
Safety stock represents a hedge against uncertainty. Replenishment uncertainty can be the result of unusual usage during the replenishment cycle or uncertain delivery schedules. Safety stock helps to prevent stockouts should any of these unexpected conditions occur. There are many formulas for calculating the right amount of safety stock. The simplest is to base safety stock on 50% usage during lead time. This is an easy formula to calculate and represents a median calculation of other more advanced formulas.
To calculate safety stock the following information is used:
- A equals Current Usage for an item times ABC weight factor times .01
- B equals (Sum of Prior Usage divided by Number of Periods) times (1 – ABC factor times .01)
- Weighted Monthly Usage (WMU) equals A plus B
- Lead times in months equals Lead Time in days divided by 30.55 days per month
- WMU during lead time equals WMU times Lead time in months
- Safety Stock equals WMU during lead time times .5
Reorder Point
The question of when to order requires that we know the lead time, which is the time interval between placing an order and receiving delivery; know the EOQ; and be certain of demand during lead time. The reorder point for an item is commonly computed as safety stock plus the average usage during the lead time.
To approximate these figures, the following information from the Inventory system is used.
- A = Current Usage for an item times ABC factor (refer to the following for a description of the ABC Factor)
- B = (Sum of Prior Usage) divided by Number of Periods times (1 – ABC factor)
The definition of prior usage is the number of GL period of history (up to 13) or the number of periods that exist at the time if actual history is less than that.
Weighted Monthly Usage (WMU) = A plus B
This provides an approximation of monthly usage for each item by applying an ABC factor.
Lead time, which is carried in the Inventory masterfile in days, is converted to months by dividing by the average number of days per month.
Lead times in months = Lead Time in days divided by 30.55 days per month
Therefore:
WMU during Lead Time = WMU times Lead Time in months
-and-
Reorder Point = Safety Stock plus WMU During Lead Time
Total Cost and the Economic Order Quantity
Summing the two costs together gives the annual total cost of orders. To find the optimal quantity that minimizes this cost, the annual total cost is differentiated with respect to Q. It is shown as
Example
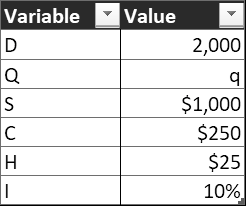
For example, a company faces an annual demand of 2,000 units. It costs the company $1,000 for every order placed and $250 per unit of the product. It faces a carrying cost of 10% of a unit cost. What is the economic order quantity?
The variables can be arranged as follows:
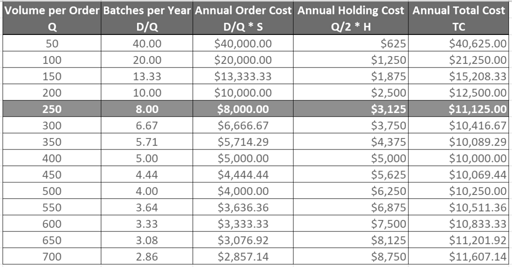
The cost for each value of Q is shown as: