Econometric model building and simulation is attractive as a sales forecasting method for companies marketing durable goods. This approach uses an equation or system of equations to represent a set of relationships among sales and different demand-determining independent variables. Then, by “plugging in” values (or estimates) for each independent variable (that is, by “simulating” the total situation), sales are forecast. An econometric model (unlike a regression model) is based upon an underlying theory about relationships among a set of variables, and parameters are estimated by statistical analysis of past data. An econometric sales forecasting model is an abstraction of a real-world situation, expressed in equation form and used to predict sales. For example, the sales equation for a durable good can be written.
S = R + N
Where
S = total sales
R = replacement demand (purchases made to replace product units going out of use, as measured by the scrap page of old units)
N = new-owner demand (purchases made not to replace existing product units, but to add to the total stock of the product in users’ possession)
Total sales of a durable good, in other words, consist of purchases made to replace units that have been scrapped and purchases by new owners. Thus, a family that has a five-year-old machine trades it in to a dealer as part payment for a new machine and becomes part of the replacement demand (although only effectively so when the five-year-old machine, perhaps passing through several families’ hands in the process, finally comes to be owned by a family that goes ahead and consigns its even-older machine to the scrap heap).
Replacement demand is measured by the scrap page of old units of products, that it, by the percentage of the total stock of the product in users’ hands that is taken out of service through consignment to the trash pile, by sale to a junk dealer, or merely by being stowed away and never used again. Replacement demand in any one year does not include demand originating from the family that had a five-year-old machine that it traded to a dealer for a new machine, with the dealer reselling the old machine to another family who buys it second-hand. Only when a particular machine goes completely out of service is it regarded as scrapped, and, at that time (through a chain of purchases and trade-ins), some family becomes a part of replacement demand. Econometricians estimate replacement demand by using life expectancy of survival tables, which are similar to the life (or mortality) tables used by life insurance actuaries. An example is shown in Figure 7.2
If some durable goods has a maximum service life of eleven years and 10,000 units of the good enter service in some year, the table indicates that five years later, 8,621 will probably still be in service, and ten years later, 54. For this batch of 10,000 products units, scrap page is 1,035 in the fifth year (that is, 1,379-344, the difference between the accumulated total scrap page at the close of the fifth and fourth years, respectively). In the fifth year, then, 1,035 replacement sales trace back to the batch of 10,000 product units that entered service five years before.
New-owner demand is the net addition to users’ stocks of the product that occurs during a given period. For instance, if 2,000,000 units of some appliance were in service at the start of a period and 2,500,000 at the end, new-owner demand was 500,000 during the period. Forecasting the number of sales to new owners involves treating the stock of the product in the hands of users as a “population” exhibiting “birth” and “death” characteristics, that is, thinking of it as being analogous to a human population.
Constructing this sort of econometric model requires going through three steps. First, study independent variables affecting each demand category (replacement and new owner) and choose for correlation analysis those that bear some logical relationship to sales (the dependent variable).
Figure 7.2 Durable-Goods Survival Coefficients (Maximum Service)
| Year | Survival/Coefficient |
| 1. | 0000 |
| 0. | 9995 |
| 0. | 9946 |
| 0. | 9656 |
| 0. | 8621 |
| 0. | 6406 |
| 0. | 3594 |
| 0. | 1379 |
| 0. | 0344 |
| 0. | 0054 |
| 0. | 0000 |
Second, detect that combination of independent variables that correlates best with sales. Third, choose a suitable mathematical expression to show the quantitative relationships among the independent variable and sales, the dependent variables. This expression becomes the econometric model.
The procedure for building econometric models is simple, but finished models can take on formidable appearances. Consider, for example, this econometric model for forecasting sales of washing machines.
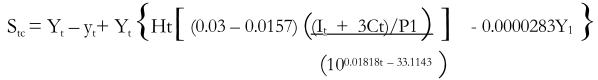
Where
Stc= calculated value for forecasted sales of washing machines during some time period
Yt = level of consumers’ stock that would occur in the following period
(as of January 1) if no washing machines were sold and scrap page rates
Yt= level of consumers’ stock that would occur in the following period (as of January 1) if no washing machines were sold and scrap page rates remained the same
Ht= number of wired (i.e., electrified) dwelling units, in millions
It= disposable personal income
Ct= net credit extended (excluding credit extended for automobiles)
Pt = price index for house furnishings
100.01818t – 33.1143 = trend of real purchasing power over time
It + 3Ct/Pt = real purchasing power
Thus, new owner demand in this model is represented by Yt – yt, determined by applying appropriated survival coefficients to previous years’ sales of washing machine and estimating consumers’ total stocks of washing machines in each year. Replacement demand is represented by the other symbols in the equation and takes into account the number of wired dwelling units (washing machines are not sold to people who live in homes with no electricity) real purchasing power (disposable personal income plus credit availability divided by a price index), and real purchasing power adjusted for the historical trend. Regression analysis was used to derive the numerical values in this model.
Econometric model building seems a nearly ideal way to forecast sales. Not only does it consider the interaction of independent variables that bear logical and measurable relation- ships to sales, it uses regression analysis techniques to quantify these relationships. Econometric models, however, are best used to forecast industry sales not the sales of individual companies. This is because the independent variables affecting an individual company’s sales are more numerous and more difficult to measure than are those determining the sales of an entire industry. Many companies use an econometric model to forecast industry sales, and then apply an estimate of the company’s share-of the-market percentage to the industry forecast to arrive at a first approximation for the company’s forecasted sales.
