Even though the VSMs are complex on observation but, their construction is easy when taken in logical steps. VSM mapping involves step by step development of the VSM state map whether a present or of future state map. In this section, preparation of a present state VSM is detailed
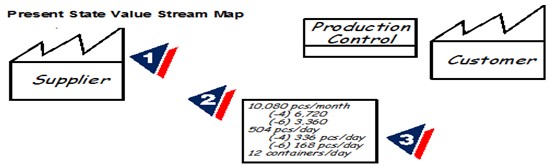
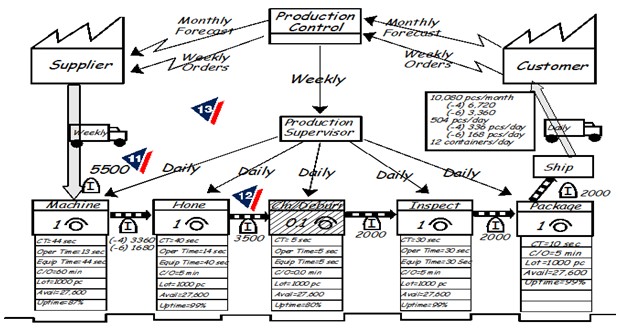
Step 1 – Draw customer, supplier and production control icons.
Step 2 – Enter customer requirements.
Step 3 – Calculate daily production required.
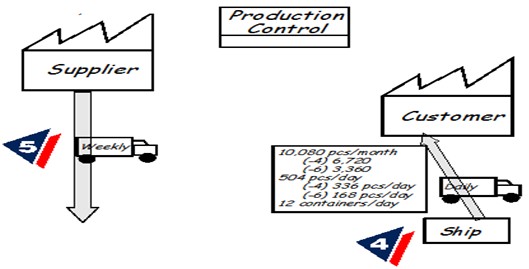
Step 4 – Draw outbound shipping icon and truck with delivery frequency.
Step 5 – Draw inbound shipping icon, truck and delivery frequency.
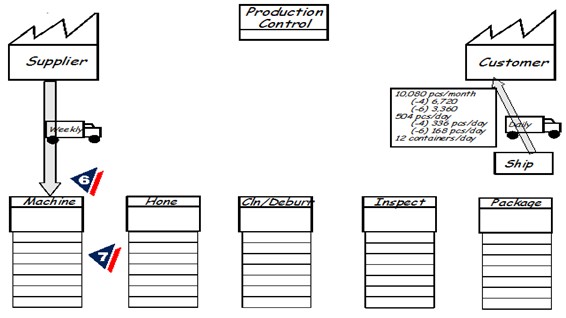
Step 6 – Add process boxes, in sequence, left to right.
Step 7 – Add data boxes below.
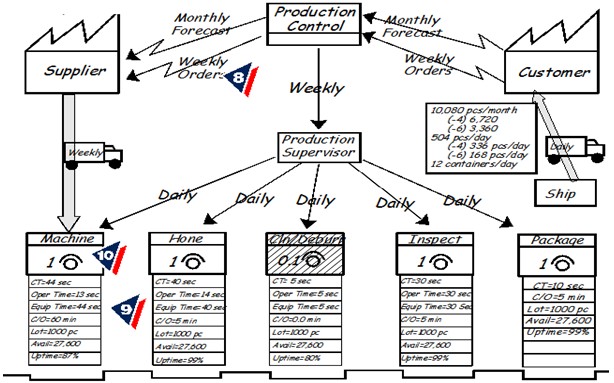
Step 8 – Add communication arrows with methods and frequencies.
Step 9 – Obtain process attributes. Add to data boxes.
Step 10 – Add operator symbols.
Step 11 – Add inventory locations and levels in days of demand graph at bottom.
Step 12 – Add push, pull and FIFO icons.
Step 13 – Add other useful information.
Step 14 – Add working hours.
Step 15 – Add cycle times (CT) and lead times.
Step 16 – Calculate total cycle lead time.
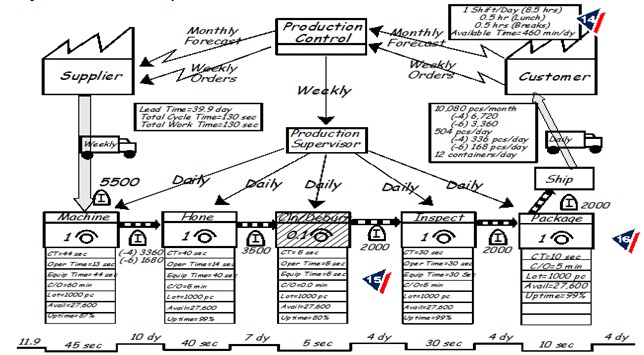
Cycle Time (CT) is the time taken to complete the corresponding process. Changeover Over Time (C/O) is the time involved for changing from one model to another. Uptime (UT) is the actual operating time divided by available time and with changeover time it is calculated as
UT = (AT-C/O)/AT
