A query is a form of questioning, in a line of inquiry. A data query is used to extract data from the database or collection of data, in a readable format according to the user’s request. For instance, if you have an employee table, you might issue a data query that returns the employee who is paid the most.
Various data queries that are easily used in Excel includes sorting and filtering the data.
Filter and multiple filter
Filtering is a quick and easy way to find and work with a subset of data in a list. A filtered list displays only the rows that meet the criteria you specify for a column. Microsoft Excel provides two commands for filtering lists
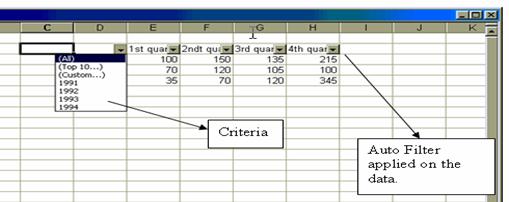
When you use the AutoFilter command, AutoFilter arrows appear to the right of the column labels in the filtered list. Clicking an AutoFilter arrow displays a list of all unique, visible items in the column, including blanks (all spaces) and nonblanks. By selecting an item from a list for a specific column, you can instantly hide all rows that don’t contain the selected value. You use custom AutoFilter to display rows that contain either one value or another. You can also use custom AutoFilter to display rows that meet more than one condition for a column, such as rows that contain values within a specific range (such as values between 2,000 and 3,000).
Finding specific values in rows in a list by using one or two comparison criteria for the same column, point to Filter on the Data menu, click AutoFilter, click the arrow in the column that contains the data you want to compare, and then click Custom. Then,
- To match one criterion, click the comparison operator you want to use in the first box under Show rows where, and then enter the value you want to match in the box immediately to the right of the comparison operator.
- To display rows that meet two conditions, enter the comparison operator and value you want, and then click the And button. In the second comparison operator and value boxes, enter the operator and value you want.
- To display rows that meet either one condition or another condition, enter the comparison operator and value you want, and then click the Or button. In the second comparison operator and value boxes, enter the operator and value you want
This is illustrated in the given figure
Automatic filter options
| To | Click |
| Display all rows | All |
| Display all rows that fall within the upper or lower limits you specify, either by item or percentage | Top 10 |
| Apply two criteria values within the current column, or use comparison operators other than AND (the default operator) | Custom |
| Display only rows that contain a blank cell in the column | Blanks |
| Display only rows that contain a value in the column | NonBlanks |
Sorting
Sorting involves arranging data for easy grasp, so that any query related to the minimum or maximum, can be accomplished quickly.
Steps to Sort the List
Using one sort column
Following steps have to be taken
- Click a cell in the column you would like to sort by.
- Click Sort Ascending on the standard toolbar.
Using two, three or more sort column
Following steps have to be taken
- Click a cell in the list you want to sort.
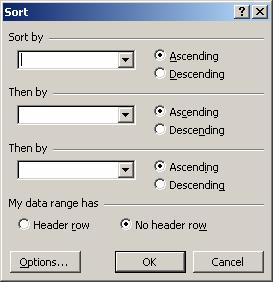
- On the Data menu, click Sort.
- In the Sort by and Then by boxes, click the columns you want to sort.
- If you need to sort by more than three columns, sort by the least important columns first. For example, if your list contains employee information and you need to organize it by Department, Title, Last Name, and First Name, sort the list twice. First, click First Name in the Sort by box and sort the list. Second, click Department in the Sort by box, click Title in the first Then by box, and click Last Name in the second Then by box, and sort the list.
- Select any other sort options you want, and then click OK.
Repeat steps if needed, using the next most important columns.