CPM and PERT are scheduling techniques. The critical path identified in a PERT/CPM chart shows managers which activities are the most time-critical.
CPM
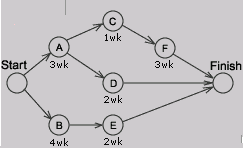
CPM or “Critical Path Method” – It is a tool to analyze project and determine duration, based on identification of “critical path” through an activity network. The knowledge of the critical path can permit project managers to change duration. It is a project modeling technique developed in 1950s and is used with all forms of projects. It displays activities as nodes or circles with known activity times.
CPM is a diagram showing every step of the project, as letters with lines to each letter representing the sequence in which the project steps take place. A list of activities is required to complete the project and the time (duration) that each activity will take to complete, along with the sequence and dependencies between activities. CPM lays out the longest path of planned activities to the end of the project as well as the earliest and latest that each activity can start and finish without delaying other steps in the project. The project manager can then, determine which activities in the project need to be completed before others and how long those activities can take before they delay other parts of the project. They also get to know which set of activities is likely to take the longest, also called as the critical path which is also the shortest possible time period in which the project can be completed.
PERT
A PERT chart (program evaluation review technique) is a form of diagram for CPM that shows activity on an arrow diagram. PERT charts are more simplistic than CPM charts because they simply show the timing of each step of the project and the sequence of the activities. In PERT, estimates are uncertain and ranges of duration and the probability that activity duration will fall into that range is taken whereas CPM is deterministic.
A PERT chart is a graphic representation of a project’s schedule, showing the sequence of tasks, which tasks can be performed simultaneously, and the critical path of tasks that must be completed on time in order for the project to meet its completion deadline. The chart can be constructed with a variety of attributes, such as earliest and latest start dates for each task, earliest and latest finish dates for each task, and slack time between tasks. A PERT chart can document an entire project or a key phase of a project. The chart allows a team to avoid unrealistic timetables and schedule expectations, to help identify and shorten tasks that are bottlenecks, and to focus attention on most critical tasks. It is most useful for planning and tracking entire projects or for scheduling and tracking the implementation phase of a planning or improvement effort.
Developing PERT Chart
- Identify all tasks or project components – Ensure the team has knowledge of the project so that during the brainstorming session all component tasks needed to complete the project are captured. Document the tasks on small note cards.
- Identify the first task that must be completed – Place the appropriate card at the extreme left of the working surface.
- Identify any other tasks that can be started simultaneously with task #1 – Align these tasks either above or below task #1 on the working surface.
- Identify the next task that must be completed – Select a task that must wait to begin until task #1(or a task that starts simultaneously with task #1) is completed. Place the appropriate card to the right of the card showing the preceding task.
- Identify any other tasks that can be started simultaneously with task #2 – Align these tasks either above or below task #2 on the working surface.
- Continue this process until all component tasks are sequenced.
- Identify task durations – Reach a consensus on the most likely amount of time each task will require for completion. Duration time is usually considered to be elapsed time for the task, rather than actual number of hours/days spent doing the work. Document this duration time on the appropriate task cards.
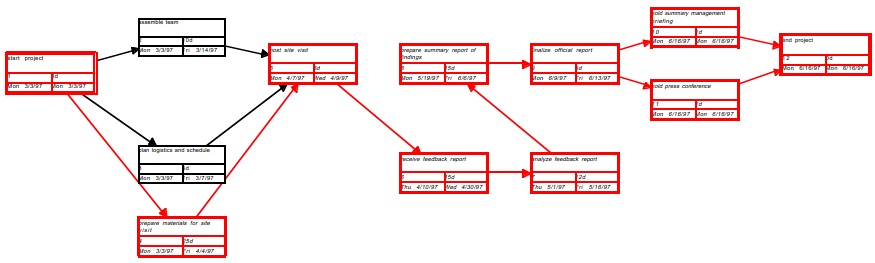
- Construct the PERT chart – Number each task, draw connecting arrows, and add task characteristics such as duration, anticipated start date, and anticipated end date.
- Determine critical path – The project’s critical path includes those tasks that must start or finish on time to avoid delays to the total project. Critical paths are typically displayed in red.