Statisticians use a confidence interval to express the precision and uncertainty associated with a particular sampling method. A confidence interval consists of three parts.
- A confidence level.
- A statistic.
- A margin of error.
The confidence level describes the uncertainty of a sampling method. The statistic and the margin of error define an interval estimate that describes the precision of the method. The interval estimate of a confidence interval is defined by the sample statistic + margin of error.
For example, suppose we compute an interval estimate of a population parameter. We might describe this interval estimate as a 95% confidence interval. This means that if we used the same sampling method to select different samples and compute different interval estimates, the true population parameter would fall within a range defined by the sample statistic + margin of error 95% of the time.
Confidence intervals are preferred to point estimates, because confidence intervals indicate (a) the precision of the estimate and (b) the uncertainty of the estimate.
A confidence interval estimate specifies a range of plausible values for a population characteristic. For example, using sample data and what you know about the behavior of the sample proportion, it is possible to construct an interval that you think should include the actual value of the population proportion. Because a sample provides only incomplete information about the population, there is some risk involved with a confidence interval estimate. Occasionally, but hopefully not very often, a sample will lead you to an interval that does not include the value of the population characteristic. If this were to happen and you make a statement such as “the proportion of coastal residents who would refuse to evacuate is between 0.30 and 0.32,” you would be wrong. It is important to know how likely it is that the method used to calculate a confidence interval estimate will lead to a correct statement. So, associated with every confidence interval is a confidence level which specifies the “success rate” of the method used to produce the confidence interval.
A confidence interval is an interval that you think includes the value of the population characteristic. It is constructed so that, with a chosen degree of confidence, the value of the characteristic will be captured between the lower and upper endpoints of the interval. The confidence level associated with a confidence interval is the success rate of the method used to construct the interval. Many factors influence the choice of confidence level. Often an investigator wishes to make an inference about the proportion of individuals or objects in a population that possess a particular property of interest. For example, a university administrator might be interested in the proportion of students who prefer a new web-based computer registration system to the previous registration method.
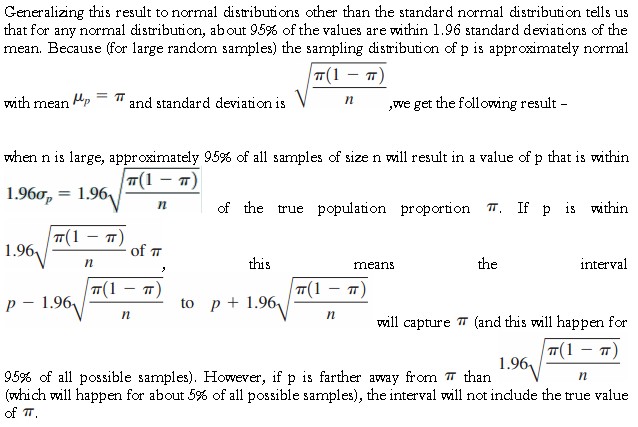
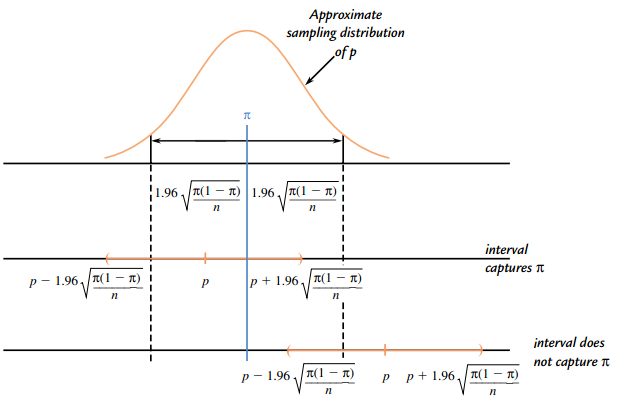
When n is large, the sample proportion p has a sampling distribution that is approximately normal with mean and standard deviation  .
.
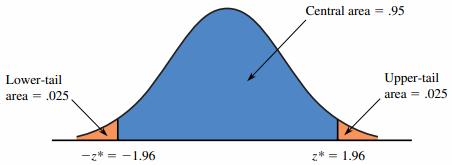
The development of a confidence interval for is easier to follow if we select a particular confidence level. For a confidence level of 95%, as per the table of standard normal (z) curve areas, can be used to determine a value z* such that a central area of .95 falls between -z* and z*. In this case, the remaining area of .05 is divided equally between the two tails, as shown in the figure. The total area to the left of the desired z* is .975 (.95 central area +.025 area below -z*). By locating .9750 in the body of table, we find that the corresponding z critical value is 1.96.
The interval can be used as long as
- np >= 10 and n(1 – p) >=10,
- the sample size is less than 10% of the population size if sampling is without replacement,
- the sample can be regarded as a random sample from the population of interest.
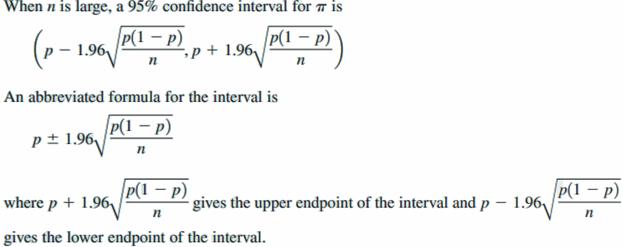
The Large-Sample Confidence Interval for π
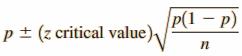
The general formula for a confidence interval for a population proportion when
- p is the sample proportion from a random sample
- the sample size n is large (np >= 10 and n(1- p) >= 10)
- if the sample is selected without replacement, the sample size is small relative to the population size (n is at most 10% of the population size) is
Why settle for 95% confidence when 99% confidence is possible? Because the higher confidence level comes with a price tag. The resulting interval is wider than the 95% interval.
Example
Results of a survey of 1100 drivers. Of those surveyed, 990 admitted to careless or aggressive driving during the previous six months. Assuming that it is reasonable to regard this sample of 1100 as representative of the population of drivers, we can use this information to construct an estimate of , the true proportion of drivers who have engaged in careless or aggressive driving in the past six months.
For this sample – p = 990/1100 = 0.900
Because np = 990 and n(1-p) = 110 are both greater than or equal to 10, the sample size is large enough to use the formula for a large-sample confidence interval. A 90% confidence interval for is then
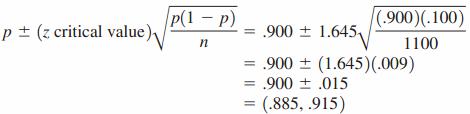
Based on these sample data, we can be 90% confident that the true proportion of drivers who have engaged in careless or aggressive driving in the past six months is between .885 and .915. We have used a method to construct this interval estimate that has a 10% error rate.
The confidence level for the z confidence interval for a population proportion is only approximate. That is, when we report a 95% confidence interval for a population proportion, the 95% confidence level implies that we have used a method that produces an interval that includes the actual value of the population proportion 95% of the time in repeated sampling. In fact, because the normal distribution is only an approximation to the sampling distribution of p, the true confidence level may differ somewhat from the reported value. If the conditions (1) np>=10 and n(1-p)>=10 and (2) n is at most 10% of the population size if sampling without replacement are met, the normal approximation is reasonable and the actual confidence level is usually quite close to the reported level; this is why it is important to check these conditions before computing and reporting a z confidence interval for a population proportion.
