A business undertaking may have different manufacturing establishments each having its own production capacity, and fixed costs but producing the same product. At the same time, the concern as a whole is a unit having different establishments under the same management. Hence the combined fixed costs have to be met by the combined BEP sales. In this analysis, there are two approaches namely:
- Constant product mix approach.
- Variable product mix approach.
Under the first approach, the ratio in which the products of the various establishments are mixed is constant. This mix will be maintained at BEP sales also. Under the second approach the product of that establishment would be preferred where the contribution ratio is higher. The above two approaches are explained by the following illustration.
Illustration 14
‘A Limited’ has two factories X and Y producing the same article whose selling price is 150 per unit. The following are the other particulars:
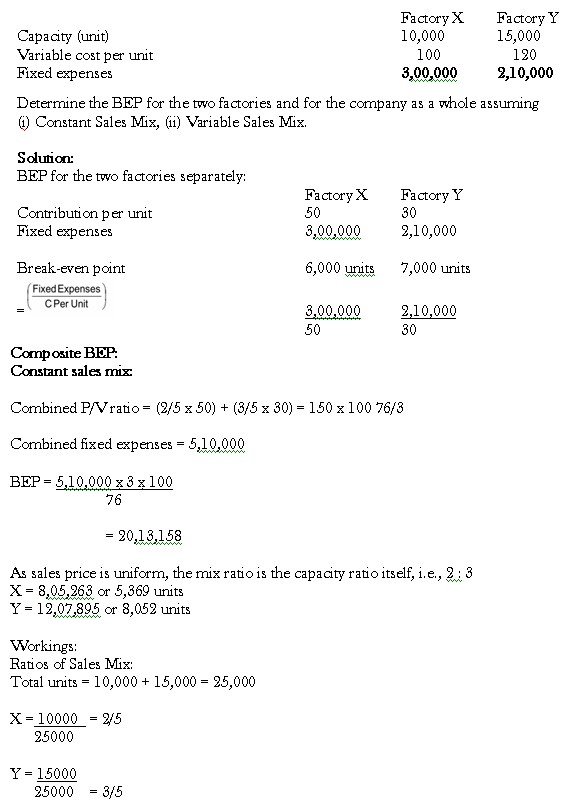
Variable Sales Mix
As factory X is giving a higher contribution, it shall be used in full, i.e., 10,000 units should be produced here before production is commenced at Y. This will give a contribution of 5, 00,000.
Total fixed expenses for the two factories
Additional contribution required to meet the fixed expenses fully Number of units to be produced at Y to produce this contribution
Total number of units:
X 10,000
Y 334 10,334
The above discussion could also be applied to an undertaking selling different products each having its own contribution and sales potential. The composite BEP for the business could be worked out keeping the product mix constant. This would involve working out a composite P/V Ratio as in the above case.
Illustration 15
There are two plants manufacturing the same products under one corporate management which decides to merge them.
Following particulars are available regarding the two plants:
Plant I Plant II
Capacity operation 100% 60%
Sales 6,00,00,000 2,40,00,000
Variable costs 4,40,00,000 1,80,00,000
Fixed costs 80,00,000 40,00,000
You are required to calculate for the consideration of the Board of directors:
- What would be the capacity of merged plant to be operated for purpose of break-even?
- What would be the profitability on working at 75 per cent of the merged capacity?
Solution:
Note: Sales and variable costs of Plant II must be brought from 60% to 100% before merger of two plants data at 100% capacity operation.
(a) Calculation of the Capacity of Merged Plant to Break-even at 100% Capacity.
P/V Ratio = Contribution Sales x 100
Sales
P/V ratio =26000000 x 100
1000000
= 26 per cent.
Sales at Break-even Point = Fixed Costs
P / V Ratio
= 1,20,000
26%
= 4,61,53,846 (Approx.)
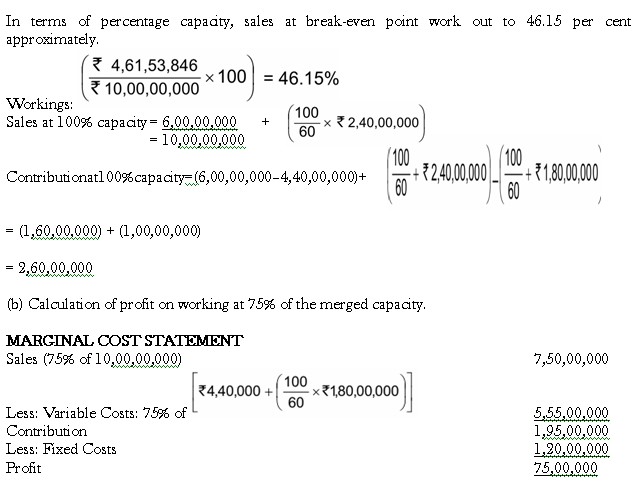
Illustration 16
The budgeted results of X Ltd. include the following:
Sales Amount (in lakhs) Variable Costs as % of Sales Value
A 5.00 60%
B 4.00 50%
C 8.00 65%
D 3.00 80%
E 6.00 75%
26.00 65.77%
Fixed costs for the period are 9 lakhs. You are required to:
- Produce a statement showing the amount of loss expected, and
- Recommend a change in sales volume of each product which will eliminate the expected loss assuming that sale of only one product can be increased at a time.
Solution:
(a) Statement showing the loss expected
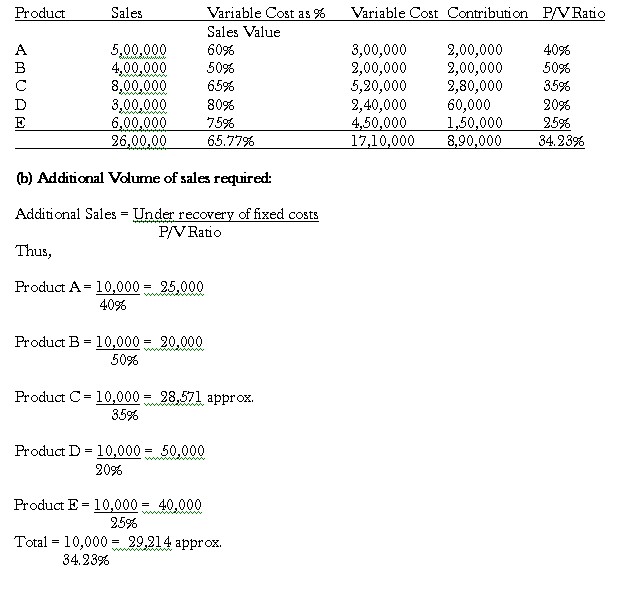
The calculations given above clearly show that, if X Co. Ltd., can increase sales of product A by 25,000 or that of product E by 40,000 its business operations would touch the break- even point.
Note: P/V Ratio in respect of different products has been calculated as thus:
Using the formula:
Sales− Variable cost
Sales
Therefore:
Product A = 5,00,000-3,00,000 x 100 =40%
5,00,000
Product B = 4,00,000 – 2,00,000 x 100 =50%
4,00,000
Product C = 8,00,000 −5,20,000 x 100 =35%
8,00,000
Product D = 3,00,000 − 2,4 0,000 x 100=20%
3,00,000
Product E = 6,00,000 – 4,50,000 x 100=25%
6,00,000
