Clustering is a division of data into groups of similar objects. Representing the data by fewer clusters necessarily loses certain fine details, but achieves simplification. It models data by its clusters. Data modeling puts clustering in a historical perspective rooted in mathematics, statistics, and numerical analysis. From a machine learning perspective clusters correspond to hidden patterns, the search for clusters is unsupervised learning, and the resulting system represents a data concept. From a practical perspective clustering plays an outstanding role in data mining applications such as scientific data exploration, information retrieval and text mining, spatial database applications, Web analysis, CRM, marketing, medical diagnostics, computational biology, and many others.
Cluster analysis or clustering, itself is not one specific algorithm, but the general task to be solved. It can be achieved by various algorithms that differ significantly in their notion of what constitutes a cluster and how to efficiently find them. Popular notions of clusters include groups with small distances among the cluster members, dense areas of the data space, intervals or particular statistical distributions. Clustering can therefore be formulated as a multi-objective optimization problem. The appropriate clustering algorithm and parameter settings (including values such as the distance function to use, a density threshold or the number of expected clusters) depend on the individual data set and intended use of the results. Cluster analysis as such is not an automatic task, but an iterative process of knowledge discovery or interactive multi-objective optimization that involves trial and failure. It will often be necessary to modify data preprocessing and model parameters until the result achieves the desired properties.
The notion of a “cluster” cannot be precisely defined, which is one of the reasons why there are so many clustering algorithms. There is a common denominator: a group of data objects. However, different researchers employ different cluster models, and for each of these cluster models again different algorithms can be given. The notion of a cluster, as found by different algorithms, varies significantly in its properties. Understanding these “cluster models” is key to understanding the differences between the various algorithms. Typical cluster models include:
- Connectivity models: for example hierarchical clustering builds models based on distance connectivity.
- Centroid models: for example the k-means algorithm represents each cluster by a single mean vector.
- Distribution models: clusters are modeled using statistical distributions, such as multivariate normal distributions used by the Expectation-maximization algorithm.
- Density models: for example DBSCAN and OPTICS defines clusters as connected dense regions in the data space.
- Subspace models: in Biclustering (also known as Co-clustering or two-mode-clustering), clusters are modeled with both cluster members and relevant attributes.
- Group models: some algorithms do not provide a refined model for their results and just provide the grouping information.
- Graph-based models: a clique, i.e., a subset of nodes in a graph such that every two nodes in the subset are connected by an edge can be considered as a prototypical form of cluster. Relaxations of the complete connectivity requirement (a fraction of the edges can be missing) are known as quasi-cliques, as in the HCS clustering algorithm.
A “clustering” is essentially a set of such clusters, usually containing all objects in the data set. Additionally, it may specify the relationship of the clusters to each other, for example a hierarchy of clusters embedded in each other. Clusterings can be roughly distinguished as:
- hard clustering: each object belongs to a cluster or not
- soft clustering (also: fuzzy clustering): each object belongs to each cluster to a certain degree (e.g. a likelihood of belonging to the cluster)
There are also finer distinctions possible, for example:
- strict partitioning clustering: here each object belongs to exactly one cluster
- strict partitioning clustering with outliers: objects can also belong to no cluster, and are considered outliers.
- overlapping clustering (also: alternative clustering, multi-view clustering): while usually a hard clustering, objects may belong to more than one cluster.
- hierarchical clustering: objects that belong to a child cluster also belong to the parent cluster
- subspace clustering: while an overlapping clustering, within a uniquely defined subspace, clusters are not expected to overlap.
- In a fuzzy clustering , every object belongs to every cluster with a membership weight that is between 0 (absolutely doesn’t belong) and 1 (absolutely belongs).
- A complete clustering assigns every object to a cluster, whereas a partial clustering does not.
- Well-Separated A cluster is a set of objects in which each object is closer (or more similar) to every other object in the cluster than to any object not in the cluster.
- Prototype-Based A cluster is a set of objects in which each object is closer (more similar) to the prototype that defines the cluster than to the prototype of any other cluster.
- Graph-Based If the data is represented as a graph, where the nodes are objects and the links represent connections among objects
Applications of Cluster Analysis
- Clustering analysis is broadly used in many applications such as market research, pattern recognition, data analysis, and image processing.
- Clustering can also help marketers discover distinct groups in their customer base. And they can characterize their customer groups based on the purchasing patterns.
- In the field of biology, it can be used to derive plant and animal taxonomies, categorize genes with similar functionalities and gain insight into structures inherent to populations.
- Clustering also helps in identification of areas of similar land use in an earth observation database. It also helps in the identification of groups of houses in a city according to house type, value, and geographic location.
- Clustering also helps in classifying documents on the web for information discovery.
- Clustering is also used in outlier detection applications such as detection of credit card fraud.
- As a data mining function, cluster analysis serves as a tool to gain insight into the distribution of data to observe characteristics of each cluster.
Clustering Algorithms
Clustering algorithms can be categorized based on their cluster model, as
Partitioning Method – Suppose we are given a database of ‘n’ objects and the partitioning method constructs ‘k’ partition of data. Each partition will represent a cluster and k ≤ n. It means that it will classify the data into k groups, which satisfy the following requirements −
- Each group contains at least one object.
- Each object must belong to exactly one group.
For a given number of partitions (say k), the partitioning method will create an initial partitioning. Then it uses the iterative relocation technique to improve the partitioning by moving objects from one group to other.
Hierarchical Methods – This method creates a hierarchical decomposition of the given set of data objects. We can classify hierarchical methods on the basis of how the hierarchical decomposition is formed. There are two approaches here −
- Agglomerative Approach – This approach is also known as the bottom-up approach. In this, we start with each object forming a separate group. It keeps on merging the objects or groups that are close to one another. It keeps on doing so until all of the groups are merged into one or until the termination condition holds.
- Divisive Approach – This approach is also known as the top-down approach. In this, we start with all of the objects in the same cluster. In the continuous iteration, a cluster is split up into smaller clusters. It is down until each object in one cluster or the termination condition holds. This method is rigid, i.e., once a merging or splitting is done, it can never be undone.
Here are the two approaches that are used to improve the quality of hierarchical clustering
- Perform careful analysis of object linkages at each hierarchical partitioning.
- Integrate hierarchical agglomeration by first using a hierarchical agglomerative algorithm to group objects into micro-clusters, and then performing macro-clustering on the micro-clusters.
Density-based Method – This method is based on the notion of density. The basic idea is to continue growing the given cluster as long as the density in the neighborhood exceeds some threshold, i.e., for each data point within a given cluster, the radius of a given cluster has to contain at least a minimum number of points.
Grid-based Method – In this, the objects together form a grid. The object space is quantized into finite number of cells that form a grid structure. The major advantage of this method is fast processing time. It is dependent only on the number of cells in each dimension in the quantized space.
Model-based methods – In this method, a model is hypothesized for each cluster to find the best fit of data for a given model. This method locates the clusters by clustering the density function. It reflects spatial distribution of the data points.
This method also provides a way to automatically determine the number of clusters based on standard statistics, taking outlier or noise into account. It therefore yields robust clustering methods.
Constraint-based Method – In this method, the clustering is performed by the incorporation of user or application-oriented constraints. A constraint refers to the user expectation or the properties of desired clustering results. Constraints provide us with an interactive way of communication with the clustering process. Constraints can be specified by the user or the application requirement.
The K-means Algorithm
The K-means clustering technique involves, first choosing K initial centroids, where K is a user-specified parameter, namely, the number of clusters desired. Each point is then assigned to the closest centroid, and each collection of points assigned to a centroid is a cluster. The centroid of each cluster is then updated based on the points assigned to the cluster. We repeat the assignment and update steps until no point changes clusters, or equivalently, until the centroids remain the same.
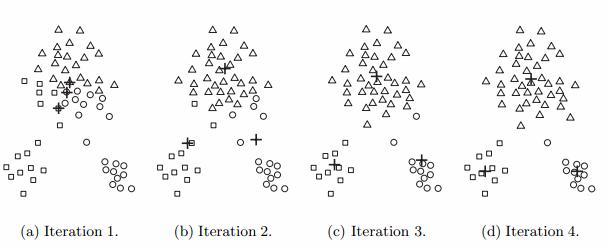
In the first step, shown in figure (a), points are assigned to the initial centroids, which are all in the larger group of points. For this example, we use the mean as the centroid. After points are assigned to a centroid, the centroid is then updated. Again, the figure for each step shows the centroid at the beginning of the step and the assignment of points to those centroids. In the second step, points are assigned to the updated centroids, and the centroids are updated again. In steps 2, 3, and 4, which are shown in figure (b), (c), and (d), respectively, two of the centroids move to the two small groups of points at the bottom of the figures. When the K-means algorithm terminates in figure (d), because no more changes occur, the centroids have identified the natural groupings of points.
For some combinations of proximity functions and types of centroids, K-means always converges to a solution; i.e., K-means reaches a state in which no points are shifting from one cluster to another, and hence, the centroids don’t change.
