Different ratios calculated from different financial figures carry different significance for different purposes. For example, for the creditor’s liquidity and solvency ratios are more significant than the profitability ratios, which are of prime importance for an investor. This means that ratios can be grouped on different basis depending upon their significance. The classification is rather crude and unsuitable to determine the profitability or financial position of the business. In general, accounting ratios may be classified on the following basis leading to overlap in many cases.
According to the Statement upon Which They Are Based
Ratios can be classified into three groups according to the statements from which they are calculated:
- Balance Sheet Ratios: They deal with relationship between two items appearing in the balance sheet, e.g., current assets to current liability or current ratio. These ratios are also known as financial position ratios since they reflect the financial position of the business.
- Operating Ratios or Profit and Loss Ratios: These ratios express the relationship between two individual and group of items appearing in the income or profit and loss statement. Since they reflect the operating conditions of a business, they are also known as operating ratios, e.g., gross profit to sales, cost of goods sold to sales, etc.
- Combined Ratios: These ratios express the relationship between two items, each appearing in different statements, i.e., one appearing in balance sheet while the other in income statement, e.g., return on investment (net profit to capital employed); Assets turnover (sales) ratio, etc. Since both the statements are involved in the calculation of each of these ratios, they are also known as inter-statement ratios.
Since the balance sheet figures refer to one point of time, while the income statement figures refer to events over a period of time, care must be taken while calculating combined or inter-statement ratios. For example while computing assets turnover ratio, average assets should be taken on the basis of opening and ending balance sheets.
Functional Classification
The classification of ratios according to the purpose of its computation is known as functional classification. On this basis ratios are categorized as follows:
- Profitability Ratios: Profitability ratios give some yardstick to measure the profit in relative terms with reference to sales, assets or capital employed. These ratios highlight the end result of business activities. The main objective is to judge the efficiency of the business.
- Turnover Ratios or Activity Ratios: These ratios are used to measure the effectiveness of the use of capital/assets in the business. These ratios are usually calculated on the basis of sales or cost of goods sold and is expressed in integers rather than as percentages.
- Financial Ratios or Solvency Ratios: These ratios are calculated to judge the financial position of the organization from short-term as well as long-term solvency point of view. Thus, it can be sub-divided into: (a) Short-term Solvency Ratios (Liquidity Ratios) and (b) Long-term Solvency Ratios (Capital Structure Ratios).
- Market Test Ratios: These are of course, some profitability ratios, having a bearing on the market value of the shares.
The classification of the structure of ratio analysis cuts across the various bases on which it has been made. The determination of activity and profitability ratios is drawn partly from the balance sheet and partly from the Statement of Profit & Loss. Ratios satisfying the test of liquidity or solvency partake the items of the balance sheet and income statement, some activity ratios coincide with those satisfying the test of liquidity, some leverage ratios belong to the category of income statement. This clearly indicates that one basis of classification crosses into other category. However, for the purpose of consideration of individual ratios, a classification of ratio on functional basis is discussed hereunder:
Profitability Ratios
A measure of ‘profitability’ is the overall measure of efficiency. In general terms efficiency of business is measured by the input-output analysis. By measuring the output as a proportion of the input, and comparing result of similar other firms or periods the relative change in its profitability can be established.
The income (output) as compared to the capital employed (input) indicates profitability of a firm. Thus the chief profitability ratio is:
Operating Profit (net margin) x 100
Operating Capital Employed
Once this is known, the analyst compares the same with the profitability ratio of other firms or periods. Then, when he finds some contrast, he would like to have details of the reasons. These questions are sought to be answered by working out relevant ratios. The main profitability ratio and all the other sub-ratios are collectively known as ‘profitability ratios’.
Profitability ratio can be determined on the basis of either investments or sales. Profitability in relation to investments is measured by return on capital employed, return on shareholders’ funds and return on assets. The profitability in relation to sales are profit margin (gross and net) and expenses ratio or operating ratio.
Return on Investment
This ratio is also known as overall profitability ratio or return on capital employed. The income (output) as compared to the capital employed (input) indicates the return on investment. It shows how much the company is earning on its investment. This ratio is calculated as follows:
Return on Investment = Net Operating Profit x 100
Capital Employed
Capital employed comprises share capital and reserves and surplus, long-term loans minus non-operating assets and fictitious assets. It can also be represented as net fixed assets plus working capital (i.e. current assets minus current liabilities).
Capital employed = Share Capital + Reserve and Surplus + Long- term Loans −Non-Operating Assets −Fictitious Assets
OR
Capital employed = Net fixed assets + working capital
In using overall profitability ratio as the chief measure of profitability, the following two notes of caution should be kept in mind. First, the figure of operating profit shows the profit earned throughout a period. The figure of capital employed on the other hand refers to the values of assets as on a balance sheet date. As the values of assets go on changing throughout a business period it may be advisable to take the average assets throughout a period, so that the profits are compared against average capital employed during a period.
Secondly, in making comparison between two different units on the basis of the overall profitability ratio, the time of incorporation of the two units should be taken care off. If a company incorporated in 2000 is compared with that incorporated in 2010, the first company’s assets will be appearing at a much lower figure than those of second company. Thus the former will show a lower capital base and if profits of both the companies are the same, the former will show a higher rate of return. This does not indicate higher efficiency; only the capital employed is lower because of the reason that it started 10 years earlier. Hence, in such cases the present value of the fixed assets should be considered for calculating the capital employed.
“Return on capital employed” should be used cautiously with clear understanding of its limitations. The ‘profits’ and “capital employed” figures are the result of a number of approximations (example, depreciation) and human judgment (valuation of assets). Therefore, the purpose of calculation of the ratio should be kept in view and appropriate figures should be selected having regard to impact of changing price levels.
Suppose a company has the following items on the liabilities side and it shows underwriting commission of 1, 00,000 on the assets side:
13% Preference capital 10,00,000
Equity capital 30,00,000
Reserves 26,00,00
Loans @ 15% 30,00,000
Current Liabilities 15,00,000
Its profit, after paying tax @ 50% is 14, 00,000. Profit before interest and tax will be 32, 50,000 which can be calculated as shown below:
Profit after tax Tax 14,00,000
Tax 14,00,000
Interest @ 15% on 30, 00,000 4,50,000
32,50,000
The operating capital employed is 95, 00,000 i.e. total of all the items on liabilities side (excluding current liabilities) less 1, 00,000, a fictitious asset (underwriting commission).
The ROI comes to
= 32,50,000× 100
95,00,000
or 34.21%
The overall profitability ratio has two components. These are the net profit ratio (operating profit/sales x 100) multiplied by turnover ratio (sales/capital employed). Therefore, ROI, in terms of percentage:
Operating Profit x 100
Capital Employed
100 x Operating Profit x Sales
Sales Capital Employed
If a management wants to maximize its profitability, it could do so by improving its net profit ratio and turnover ratio. The former refers to the margin made in each sale in terms of percentage whereas, the latter shows the utilization, i.e., rotation of the capital in making the sale. If the selling price of an article is 10 whose cost is 6, there is a margin of 4 or 40%. This shows the gap between selling price and cost price in the percentage form. The overall profitability is also dependent upon the effectiveness of employment of capital. If in this case, sales 200 were made with a capital of 100 then the rotation, i.e. the turnover is 200/100 or 2 times. Thus the business has earned a total profit of 80 with a capital of 100, profitability ratio being 80%, i.e., Net profit ratio x Turnover ratio = 40% x 2 = 80%.
Illustration 2
Determine which company is more profitable:
X Ltd Z Ltd
Net Profit Ratio 3% 4%
Sales/Capital Employed 5 times 3 times
Solution:
Judging from the net margin ratio Z Ltd. appears to be more profitable. But the criteria for determining profitability are return on capital employed which in this case works out to 15% and 12% respectively for X Ltd. and Z Ltd. Hence X Ltd. is undoubtedly more profitable.
Return on investment is a good measure of profitability in as much as it is an extension of the input-output analysis. Moreover, it aids in comparing the performance efficiency of dissimilar enterprises.
Return on Shareholders’ Funds
It is also referred to as return on net worth. In this case it is desired to work out the profitability of the company from the shareholders’ point of view and it is computed as follows:
Net Profit after Interest and Tax x 100
Share holders’ Funds
Modifications of the ‘return on capital employed’ can be made to adopt it to various circumstances. Thus if it is required to work out the profitability from the shareholders’ point of view, then the profit figure should be after interest and taxation and the capital employed should be after deducting the long-term loans. This ratio would reflect the profitability for the shareholders. To extend the idea further, the profitability from equity shareholders’ point of view can also be worked out by taking the profits after preference dividend and comparing against capital employed after deducting both long-term loans and preference capital.
Return on Assets
Here the profitability is measured in terms of the relationship between net profits and assets. It shows whether the assets are being properly utilized or not. It is calculated as:
Net Profit after Tax x 100
Total Assets
This ratio is a measure of the profitability of the total funds or investment of the organisation.
Profit Ratios
Gross Profit Ratio or Gross Margin
Gross profit ratio expresses the relationship of gross profit to net sales or turnover. Gross profit is the excess of the proceeds of goods sold and services rendered during a period over their cost, before taking into account administration, selling and distribution and financing charges. Gross profit ratio is expressed as follows:
Gross Profit x 100
Net Sales
This ratio is important to determine general profitability since it is expected that the ratio would be quite high so as to cover not only the remaining costs but also to allow proper returns to owners.
Any fluctuation in the gross profit ratio is the result of a change either in ‘sales’ or the ‘cost of goods sold’ or both. The rise or fall in the selling price may be an external factor over which the management may have little control, especially when prices are controlled. The management, however, must try to keep the other end of the margin (i.e., cost) at least steady, if not reduce it. If the gross profit ratio is lower than what it was previously, when the selling price has remained steady, it can be reasonably concluded that there is an increase in the manufacturing cost. Since manufacturing overheads include a fixed element as well, a fall in the volume of sales will also lower the rate of gross profit and vice-versa.
Net Profit Ratio
One of the components of return on capital employed is the net profit ratio (or the margin on sales) calculated as:
Net Profit Ratio = Operating Profit x 100
Sales
It indicates the net margin earned in a sale of 100. Net profit is arrived at from gross profit after deducting administration, selling and distribution expenses; non-operating incomes, such as dividends received and non-operating expenses are ignored, since they do not affect efficiency of operations.
Operating Ratio
The ratio of all operating expenses (i.e., materials used, labour, factory overheads, office and selling expenses) to sales is the operating ratio.
A comparison of the operating ratio would indicate whether the cost content is high or low in the figure of sales. If the annual comparison shows that the sale has increased, the management would be naturally interested and concerned to know as to which element of the cost has gone up.
It is not necessary that the management should be concerned only when the operating ratio goes up. If the operating ratio has fallen, though the unit selling price has remained the same, still the position needs analysis as it may be the sum total of efficiency in certain departments and inefficiency in others. A dynamic management should be interested in making a fuller analysis.
It is, therefore, necessary to break up the operating ratio into various cost ratios. The major components of cost are: material, labour and overheads. Therefore, it is worthwhile to classify the cost ratio as:
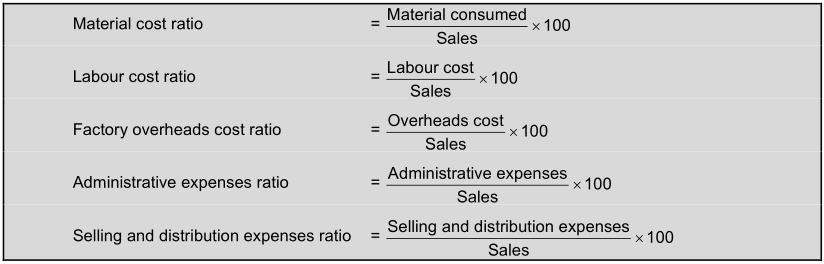
Generally all these ratios are expressed in terms of percentage. They total up to the Operating Ratio. This, deducted from 100 will be equal to the Net Profit Ratio.
If possible, the total expenditure for effecting sales should be divided into two categories, viz., fixed and variable-and then ratios should be worked out. The ratio of variable expenses to sales will be generally constant; that of fixed expenses should fall if sales increase; it will increase if sales fall.
Activity Ratios or Turnover Ratios
The ratios used to measure the effectiveness of the employment of resources are termed as activity ratios. Since these ratios relate to the use of assets for generation of income through turnover they are also known as turnover ratios, as we have seen already, the overall profitability of the business depends on two factors i.e. (i) the rate of return on sales and (ii) the rate of return on capital employed i.e. the speed at which the capital employed in the business relates. More efficient the operations of an undertaking, the quicker and more number of times the rotation is. Thus the overall profitability ratio is calculated as – Net Profit Ratio x Turnover Ratio. The net profit ratio has already been discussed. Now the important turnover ratios as regards capital employed and assets are discussed below:
Capital Turnover (Sales to Capital Employed) Ratio
This ratio shows the efficiency of capital employed in the business and is calculated as follows:
Capital Turnover Ratio = Net Sales
Capital Employed
The higher the ratio the greater are the profits.
Total Assets Turnover Ratio
This ratio is ascertained by dividing the net sales by the value of total assets. Thus,
Total Assets Turnover Ratio = Net Sales
Total Assets
A high ratio is an indicator of overtrading of total assets while a low ratio reveals idle capacity. The total Assets Turnover Ratio can be segregated into:
Fixed Assets Turnover Ratio
This ratio indicates the number of times fixed assets are being turned over in a stated period. It is calculated as:
Fixed Assets Turnover Ratio = Net Sales
Fixed Assets
This ratio is an indicator of the extent to which investment in fixed assets contributes to generate sales. The fixed assets are to be taken net of depreciation. The higher is the ratio the better is the performance.
Working Capital Turnover Ratio
This ratio shows the number of times working capital is turned-over in a stated period. This ratio is calculated as:
Working Capital Turnover Ratio = Net Sales
Working Capital
It indicates to what extent the working capital funds have been employed in the business towards sales.
Stock Turnover Ratio (Inventory Turnover Ratio)
This ratio is an indicator of the efficiency of the use of investment in stock. It is calculated as:
Stock Turnover Ratio = Cost of Goods Sold or Sales
Sales Average Inventory Average Inventory
Mostly opening and closing stock figures are given and these should be averaged. If monthly figures are available, then these figures should be averaged. In case stock level fluctuates violently, then monthly average should be calculated as under:
Opening stock + 12 months figures – Closing stock
12
In this case stock turnover ratio should be as under:
Cost of goods sold
Average stock
Too large an inventory will depress the ratio; control over inventories and active sales promotion will increase the ratio. If desired this ratio may be split into two ratios, for raw materials and for finished goods:
Material consumed ; and
Average raw material stocks
Sale or Cost of goods sold
Average stocks of finished goods
This analysis will throw a better light on the inventory position.
Average inventory is calculated on the basis of the average inventory at the beginning and at the end of the accounting period.
Debtors Turnover Ratio (Debtors’ Velocity)
These days some amount of sales always locked up in the form of book debts. Efficient credit control and prompt collection of amounts due will mean lower investments in book debts. This ratio measures the net credit sales of a firm to the recorded trade debtors thereby indicating the rate at which cash is generated by turnover of receivable or debtors. This ratio is calculated as:
Debtors Turnover Ratio = Net Sales
Average Debtors
Average debtors refer to the average of opening and closing balance of debtors for the period. Debtors include bills receivables but exclude debts which arise on account of transactions other than sale of goods. While calculating debtor’s turnover, it is important to note that provision for bad and doubtful debts are not deducted from total debtors in order to avoid the impression that a larger amount of receivables have been collected.
Debt Collection Period: This ratio indicates the extent to which the debts have been collected in time. This ratio is infact, interrelated with and dependent upon the debtors turnover ratio. It is calculated by dividing the days in a year by the debtor’s turnover. This ratio can be computed as follows:
Debtors’ collection period shows the quality of debtors since it measures the speed with which money is collected from them. It is rather difficult to specify a standard collection period for debtors. It depends upon the nature of the industry, seasonal character of the business and credit policy of the firm etc.
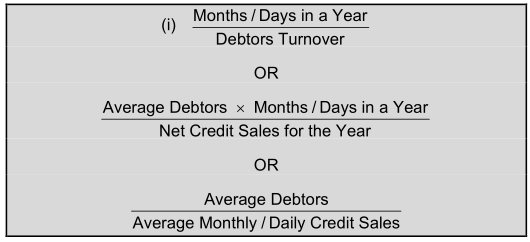
Illustration 3
From the following information, calculate, debtors turnover ratio and average collection period.
Total debtors (opening balance) 2, 00,000
Cash sales 1, 50,000
Credit sales 10, 00,000
Cash collected 7, 80,000
Sales returns 60,000
Bad debts 40,000
Discount allowed 20,000
Provision for bad debts 25,000
No. of days in a year – 360
Solution:
Total Debtors Account
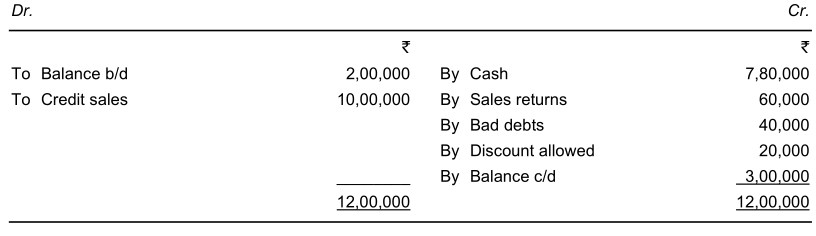
Debtors Turnover Ratio = Credit Sales
Average Debtors
Average Debtors = Opening Debtors + Closing Debtors
2
= 2,00,000+3,00,000
2
= 2,50,000
Debtors Turnover Ratio = 10,00,00 = 4 times
2,50,000
Average Collection Period = Days in the Year
Debtors Turnover Ratio
= 360 = 90 days
4
- Financial Ratios: Financial statements of a firm are analyzed for ascertaining its profitability as well as financial position. A firm is said to be financially sound provided if it is capable of meeting its commitments both short-term and long-term. Accordingly, the ratios to be computed for judging the financial position are also known as solvency ratios and those ratios which are computed for short-term solvency are known as liquidity ratios.
- Liquidity Ratio: In a short period, a firm should be able to meet all its short-term obligations i.e. current liabilities and provisions. It is current assets that yield funds in the short period – current assets are those assets which the firm can convert into cash within one year or in short run. Current assets should not only yield sufficient funds to meet current liabilities as they fall due but also enable the firm to carry on its day to day activities. The ratios to test the short-term solvency or liquidity position of an enterprise are mainly the following:
- Current Ratio: Current ratio also known as the working capital ratio, is the most widely used ratio. It is the ratio of total current assets to current liabilities and is calculated by dividing the current assets by current liabilities.
Current Ratio = Current Assets
Current Liabilities
Current assets are those assets which can be converted into cash in the short-run or within one year. Likewise, current liabilities are those which are to be paid off in the short run. Current assets normally include cash in hand or at bank, inventories, sundry debtors, loans and advances, marketable securities, pre-paid expenses, etc. while current liabilities consist of sundry creditors, bills payable, outstanding and accrued expenses, provisions for taxation, proposed and un-claimed dividend, bank overdraft etc.
Liquid Ratio
This ratio is also known as Quick Ratio or Acid Test Ratio. This ratio is calculated by relating liquid or quick assets to current liabilities. Liquid assets mean those assets which are immediately converted into cash without much loss. All current assets except inventories and prepaid expenses are categorized as liquid assets. The ratio can be computed as:
Liquid Ratio = Liquid Assets
Current Liabilities
Liquidity ratio may also be computed by substituting liquid liabilities in place of current liabilities. Liquid liabilities mean those liabilities which are payable within a short period. Bank overdraft and cash credit facilities, if they become a permanent mode of financing are to be excluded from current liabilities to arrive at liquid liabilities. Thus:
Liquid Ratio = Liquid Assets
Liquid Liabilities
This ratio is an indicator of the liquid position of an enterprise. Generally, a liquid ratio of 1:1 is considered as ideal as the firm can easily meet all current liabilities. The main difference in current ratio and liquid ratio is on account of inventories and therefore a comparison of two ratios leads to important conclusions regarding inventory holding up.
Long-term Solvency Ratios: Long-term sources and uses of funds from the basic input for computation of long-term solvency ratios. The investors i.e. shareholders and debenture holders both present and prospective are interested in knowing the financial status of the company so that they can take decisions for long-term investment of their funds. The following are the main ratios in this category.
Debt-Equity Ratio: Debt-equity ratio is the relation between borrowed funds and owners’ capital in a firm, it is also known as external-internal equity ratio. The debt-equity ratio is used to ascertain the soundness of long-term financial policies of the business. Debt means long-term loans i.e. debentures or long-term loans from financial institutions. Equity means shareholders’ funds i.e., preference share capital, equity share capital, reserves less loss and fictitious assets like preliminary expenses. It is calculated in the following ways:
Debts
Equity (Shareholders’ Funds)
OR
Debts
Long-term Funds (Shareholders’ Funds + Debts)
The main purpose of this ratio is to determine the relative stakes of outsiders and shareholders.
Proprietary Ratio: This ratio is a variant of debt-equity ratio which establishes the relationship between shareholders funds and total assets. Shareholders’ fund means, share capital both equity and preference and reserves and surplus less losses. This ratio is worked out as follows:
Proprietary Ratio = Shareholders’ Funds
Total Assets
This ratio indicates the extent to which shareholders’ funds have been invested in the assets.
Fixed Assets Ratio
The ratio of fixed assets to long-term funds is known as fixed assets ratio. It focuses on the proportion of long-term funds invested in fixed assets. The ratio is expressed as follows:
Fixed Assets
Fixed Assets Ratio = Long-term Funds
Fixed assets refer to net fixed assets (i.e. original cost-depreciation to date) and trade investments including shares in subsidiaries. Long-term funds include share capital, reserves and long-term loans.
This ratio should not be more than 1. It is the principle of financial management that not merely fixed assets but a part of working capital also should be financed by long-term funds. As such it is desirable to have the ratio at less than one i.e. say, 0.67 to indicate the fact that the entire fixed capital plus a portion of the working capital are financed by long-term funds.
Debt-Service Ratio
This ratio is also known as Fixed Charges Cover or Interest Cover. This ratio measures the debt servicing capacity of a firm in so far as fixed interest on long-term loan is concerned. It is determined by dividing the net profit before interest and taxes by the fixed charges on loans. Thus:
Debt Service Ratio = Net Profit before Interest and Tax
Interest Charges
This ratio is expressed as ‘number of times’ to indicate that profit is number of times the interest charges. It is also a measure of profitability. Since higher the ratio, higher the profitability The ideal ratio should be 6 to 7 times.
Capital Gearing Ratio: The proportion between fixed interest or dividend bearing funds and non-fixed interest or dividend bearing funds in the total capital employed in the business is termed as capital gearing ratio. Debentures, long-term loans and preference share capital belong to the category of fixed interest/dividend bearing funds. Equity share capital, reserves and surplus constitute non-fixed interest or dividend bearing funds. This ratio is calculated as follows:
Capital Gearing Ratio = Fixed Interest Bearing Funds
Equity Shareholders’ Funds
In case the fixed income bearing funds are more than the equity shareholders’ funds, the company is said to be highly geared. A low capital gearing implies that equity funds are more than the amount of fixed interest bearing securities. This ratio indicates the extra residual benefits accruing to equity shareholders. Whether the concern is operating on trading on equity can be judged by this ratio.
Market Test Ratios” These ratios are calculated generally in case of such companies whose shares and stocks are traded in the stock exchanges. Shareholders, present and probable, are interested not only in the profits of the company but also in the appreciation of the value of their shares in the stock market. The value of shares in the stock market, besides other factors, also depends upon factors like dividends declared, earning per share, the payout policy, etc., of the companies. The following ratios reflect the effect of these factors on the market value of the shares.
Earnings per Share (EPS)
This is calculated as under:
EPS =Net profit
No. of equity shares
This ratio measures the profit available to the equity shareholders on a per share basis. Suppose, the net income of company after preference dividend is 40,000 and the number of equity shares is 6,000 then,
EPS = 40,000
6,000
= 6.66 per share.
It should be noted that net income here is the net income in income statement for the period, after taking into consideration operating, non-operating, and other items like income-tax. It should be remembered that if any dividend is payable to the preference shareholders, it has to be deducted before arriving at net income for this purpose. This ratio is of considerable importance in estimating the market price of the shares. A low E.P.S. means lower possible dividends and so lower market value, while a high EPS has a favorable effect on the market value of the shares.
However, the EPS alone does not reflect the effect of various financial operations of the business. Also, its calculation may be affected, to a considerable extent, by different accounting practices and policies relating to valuation of stocks, depreciation, etc. Therefore, this ratio should be cautiously interpreted.
Price Earnings Ratio
This ratio establishes relationship between the market price of the shares of a company and its earnings per share (EPS). It is calculated as under:
Price Earnings Ratio (P/E) = Market value per equity share
Earning per Share
Assuming the market value of a share to be 40 and the EPS 6.66 per share as calculated in (i) above, then the PER comes to 6.66 or 6 times. This ratio helps in predicting the future market value of the shares within reasonable limits. It also helps in ascertaining the extent of under and over-valuation in the market price, thus pointing to the effect of factors generated by the company’s financial position. This can be illustrated by the following illustration:
Suppose, the actual market value per share is 45 while on the basis of PER and EPS it should be 6 times of EPS, i.e., 6.66 x 6 = 40. The excess of 5 between anticipated and actual market price reflects the effect of general economic and political conditions, the image of the company, etc…. which cannot be made out from company’s financial statements. A reciprocal of this ratio gives the capitalization rate of current earnings per share.
Pay-out Ratio: This ratio expresses the relationship between what is available as earnings per share and what is actually paid in the form of dividends out of available earnings. It is a good measure of the dividend policy of the company. A higher payout ratio may mean lower retention and ploughing back of profits, a deteriorating liquidity position and little or no increase in the profit-earning capacity of the company. This ratio is calculated with the help of the following formula:
Pay- out Ratio = Dividend per equity share
Earnings per share
Dividend Yield Ratio
This ratio establishes the relationship between the market price and the dividend paid per share. It is expressed as a percentage and gives the rate of return on the market value of the shares and helps in the decision of investors who are more concerned about returns on their investment rather than its capital appreciation. This ratio is calculated as under:
Dividend per share x 100
Market price per share
= 4/40 x 100 = 10%
Since dividends are declared on paid-up value of shares, they do not reflect the actual rate of earning if the shares are purchased at market price, which is generally different from paid-up value. This ratio removes this ambiguity by relating the dividends to the market value of shares. For example, if a company declares 20% dividend on its share of 20 each, having a market value of 40 each, then the real rate of return is not 20% but is 10% as calculated below:
Dividend per share x100
Market value per share
It should be noted that in the calculation of all the above four ratios (market test) preference shares are ignored and their dividend is adjusted against income, before it is considered for these ratios.
