Management of capacity basically involves capacity planning, balance between various issues against economic advantages and disadvantages and its proper utilization_, before discussing the planning and management of capacity let understand the process of measurement of capacity.
Process of Measurement of Capacity: To estimate capacity one should first select a yardstick to measure it. The first major task in capacity measurement is to define the unit of output. In some cases, the choice is obvious, for example. RIL set up capacity to manufacture250, 000MT of polypropylene and 160,000MT of polyethylene at Hazira plant. This measures the output of end products. Another example is megawatt-hours of electricity for a power generation utility. Finding a yardstick to estimate capacity is more difficult in many service industries where there is no uniform product on which the measurements can be based, e.g. , airlines, hospitals, restaurants etc. However, measures can be devised to assess capacity. For example, airlines can use seat-mileage as a measure of capacity. A hospital can measure capacity as bed-days each year. In a restaurant, this might be the number of customers that can be handled per day.
In a process focused facility, capacity is often determined by some measure of size, such as number of in a hospital, seating capacity in a restaurant, etc. In repetitive process, the number of units assembled per shift, such as number of refrigerators may be the criterion for capacity. And in product focused facility, such as TISCO, tones of steel produced per shift may be the measure of capacity.
Whatever the measure, the capacity decision is critical to the management of an organization because everything from cost to customer service is measured on the basis of capacity of the process, once the capacity is determined. In general, capacity can be expressed in one of the two ways:
- Output measures
- Input measures
Output measures are the usual choice for high volume processes. Maruti was set up to manufacture 100.000 passenger cars per year. This type of capacity measurement needs to be taken with some caution. The Maruti plant produces many types of vehicles on a single plant. As the man-hours required producing the different models are not identical. Maruti may be able to manufacture 125,000 vehicles if it only produced Maruti 800, 110,000 vehicles if it produced the Omni and 85,000vehicles if only produced Gypsy. The 100,000 number is an average number to make the capacity measurement easy.
As the amount of customization and variety in the product mix increase, output-based capacity measures become less useful. Output measures are best utilized when the firm provides a relatively a small number of standardized products and services, or when such measures are applied to individual processes within the overall firm.
Let us take another example. We could say that a plastic goods unit turns out plastic goods. Can we, therefore unambiguously make a statement of the capacity as the weight of the processed output or number of plastic goods unit period. Though, the capacity of plastic unit can be expressed as weight of plastic processed, it would not be accurate because the number will differ according to the mix of products being made. A change in product mix will usually mean a change in capacity also. Also, as there are a variety of plastic goods, coming in different shapes and sizes, the number may not be a good measure. Finally, the decision has to be based on judgment or industry practice
Input Measures are generally used for low volumes, flexible processes, For example, in a machine shop; capacity can be measured in machine hours or number of machines, Demand, which invariably is expressed as an output rate, must be converted to an input measure. This conversion is required to compare demand requirements and capacity on an equivalent basis. Capacity then may be measured in terms of inputs or outputs of the conversion process. However converting demand into output measures may be quite difficult .In a general business sense, capacity is most frequently viewed as the amount of output that a system is capable of achieving over a specific period of time.
Capacity Planning: One of the functions of capacity management is capacity planning. Capacity planning is the study of the level of capacity the organization provides at each stage of production, or service delivery system to meet its objectives. Capacity planning is a long term strategic decision that establishes a firm’s overall level of resources. The decisions are strategic because they often commit the resources of the organization for long periods .For example, Reliance’s decision to put up an ethylene cracker required an investment of hundred of crores of rupees. Similarly, large investments are required to build a refinery, or a caustic soda plant. As these expenditures are usually for fixed assets (plant and equipment) they are extensive to sustain or even more expensive to change. Capacity decisions affect product lead times customer responsiveness, operating cost and firm’s ability to compete effectively with the competitors. They also impact the survival of the firm; too much capacity can result in low return on assets, low morale, damaging lay-offs and facility closures (which are often expensive); while too little capacity can result in lost sales; , high operating cost and result in erosion of customer loyalty. From the economic point of view, capacity planning is focused on the level of capacity that we provide at each stage of production or service delivery systems. It relates to planning decisions on total assets employed by the firm. The management should invest in assets up to the point that marginal efficiency or productivity of capital employed equals interest rate.
Time Horizon in Capacity Planning: Capacity planning issues vary markedly with respect to the time horizon in which the decisions are made. It is useful to divide the time horizon into long-term, medium –term and short-term to understand the nature of issues to be addressed with respect to capacity planning in table 9.1 illustrates the salient features of capacity planning under the three time horizons.
In the long term, the emphasis in capacity planning is on making the right amount of capacity available to meet the projected growth. Typically, organizations initially make a certain investment of capacity. However, as operations stabilize and market share increases, firms need to take decisions in advance to plan for augmenting capacity.
These options differ in the amount of additional capacity that is brought into the system and the cost and technological aspects of capacity build-up. De-bottlenecking is a commonly employed method in process industries as it is easy to identify the flow and bottleneck points in the system.
Capital budgeting exercises are an integral part of the decision – making process at this stage Further, addition in capacity is likely to shift the breakeven points as fixed costs in the system go up. Therefore, it is also common for management accounting professionals to work on the breakeven points as fixed costs in the system go up. Therefore, it is also common for management accounting professionals to work on the breakeven impact of capacity augmentation decisions. Operations and maintenance personal plan in advance for the installation of additional capacity and dovetailing the new equipment with the existing system
Nine sources of waste: The Japanese concept to the sum of work and waste is a simple yet powerful method for capacity management. A manufacture of auto components has a hydraulic system that contains master cylinders. The master cylinder is manufactured using as set of six machines. The installed capacity of the master cylinder manufacturing facility was 32,000 per month. However, for a variety of reasons, the maximum production achieved was in the range of 70-75 % of the installed capacity.
A study was initiated to understand how capacity realization could be improved without any major investment in additional machines. The underlying philosophy behind the exercises was to estimate the various sources source of waste, as proposed by the canon productivity system. The table below shows some of the findings and major sources of waste.
The study highlighted two major areas of waste: materials and equipments usage. The waste due to start-up also pertains to equipments usage. Based on this study, additional studies were initiated to understand the nature of wastages pertaining to use of the equipment. The study showed how poor planning of operations and very long set up times were resulting in high idle time of the machines. The maximum set up time was found to be 16 hours, which converted the machine into the bottleneck.
| SOURCES OF WASTE | AMOUNT (RS. LACS) |
| Waste due to human resources | 19.55 |
| Waste due to materials | 215.27 |
| Waste due to operations | 14.71 |
| Waste due to start up | 52.35 |
| Waste due to equipment | 126.96 |
| Total of the above | 430.84 |
| Divisional turnover | 1359.03 |
| Waste as a percentage | 31.70% |
Set up time reduction exercises were carried out on the bottleneck machine as well as on the other machines. After a two months study and implementation of simple improvements in equipments usage and set up time procedures , the maximum set up time came down to less than 3 hours . As a result of these efforts, the actual production of master cylinders shot up to nearly 90% of the installed capacity. This experiment clearly established the usefulness of the simple yet a profound equation capacity = work +waste
In the medium –term, the focus in capacity planning shifts to balancing available capacity with demand .In the medium –term, firms have some opportunities for limited capacity augmentation by increasing the usage of existing capacity through overtime and introduction of an additional shift Further, by sub contraction part of the work to outside vendors, some capacity inadequacies can be handled on a temporary basis. It is also possible for firms to modify the demand by shifting it from a peak period to non-peak period .Several methods is available for capacity planning using the above options. These methods are often as aggregate production planning.
Capacity planning in the short-run is very different from the other two that we discussed above. In the short-run, the maximum available capacity is fixed. Therefore, the capacity planning exercise in confined to making effective use of the available capacity planning methods do not lead to keeping the capacity idle. The focus in capacity planning in the short run is no maximizing resource availability and efficient use of the resources. Several operations management tools are available to manage capacity in the short-run. These include planning and scheduling methods and maintenance management methods. Waiting line models are a generic class of tools used to analyze capacity issues in both service and manufacturing firms. Similarly, a detailed analysis of the impact of capacity on the working of the system can also be studied using simulation modeling of the system.
Capacity Planning Framework: A capacity planning exercise is initiated in response to several scenarios that an organization faces from time to time. However, two of these are more common. First is the changing market condition leading to an increase in demand of the products and services that a firm offers? Due to increased demand, the capacity becomes inadequate and calls for a detailed computation of the new requirement. Moreover, since capacity additions are done over longer intervals, an estimate of the future capacity planning exercise is the strategic decision taken with respect to introduction of new products and new markets. In this situation also there is a need to revisit the capacity issue.
Irrespective of the context a capacity planning framework consists of three important steps (figure 4.2.1). First, a careful estimation of the current and future capacity requirements is to be made. Once the capacity requirements are known, it becomes relatively easy to perform detailed computations and identify bottleneck points in the system. This constitutes the second step. In the final step, available alternatives are to be enumerated as well as some of the tools and techniques to be used, to evaluate the alternatives and select the best one. All these steps are described in details below.
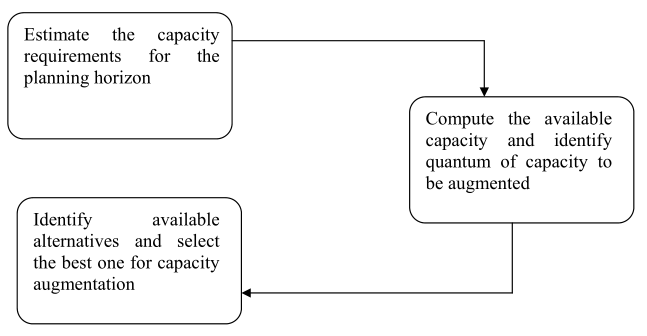
Fig. 4.1 Capacity Planning Framework
Estimating Total Requirement:-Estimation of capacity requirements begins with inputs from a forecasting exercise if the intent of the capacity planning exercise is to respond to imminent and future growth projections in the market. There are several techniques available for forecasting, which an organization can use to estimate the end product or the service offered. Capacity planning exercises typically make use of medium term and long term demand projection methods. These exercises use past data collected at the end user level and systematically aggregated in the hierarchy before being analyzed and projected into the future. Once the projections for the end product sales are forecast, then detailed capacity computations can be done at individual facilities in the plant. On the other hand, estimation of capacity requirements can also be in response to some targeted capacity build up in the factory. For example, the medium voltage circuit breakers manufacturing facility of ABB at Nasik decided to increase the capacity of its plant by 1997. In this case, the capacity requirements are computed to meet the revised target.
Once the end product requirements are estimated using appropriate techniques, estimating capacity requirements and matching them with the availability calls for detailed computations at the individual resource or division level. Labor and machines are the two major resources for which capacity planning is required. Therefore, capacity calculations are done on the basis of man hour and machine hour requirements per unit of product manufactured.
Estimating Labor and Machine Requirements: The computation of the labor requirements depends on two major factors, the amount of standard labor hours required per unit of the product and the efficiency of the labor. Let the
Projected demand per unit time during the planning horizon =D
Standard labor hours required per unit of product =SL
Efficiency of labor =EL
D x SL…………Equation 1
Then the capacity requirements (labor) = EL
Although the above computation appears simple, in reality, estimating SL and EL has certain operational difficulties. The standard labor hours are supposed to be established by a standard setting routine in every organization. This will call for studying each and every process, estimating normal allowances and incorporating them. Further, as the process is put into practice, some assumptions are required about the efficiency of the workers. The efficiency is likely to be somewhat low during the initial stages. However, as the employees experience learning curve effects, the efficiency of the process improves, thereby calling for a revision of these standard labor hours. Despite this, revisions are not done as frequently as the process warrants. This is because the earning potential of the employees is inextricably linked to standard hours and efficiency assumptions. By keeping the standards loose and efficiencies low, it is possible for some workers to earn productivity bonus even for normal work. Due to these reasons, in a vast majority of industrial organizations, SL and EL have an industrial relations angle as well. In recent years, however, the notion of productivity and the manner in which employees are rewarded for good performances in productivity are not linked to these issues.
Operations managers need to be aware of these limitations while making a judicious choice of these parameters.
One can use a similar expression for computing the machine requirements by using the subscript “M” in the place of “L”.
D x SM …………………Equation 2
Capacity requirement (Machine) = EM
Example: A manufacturer of medium voltage circuit breakers is planning for a capacity build up of 8 cubicles and 13 circuit breakers per day. A year is made of 305 working days. The fabrication division is responsible for manufacturing metal sheet components that are welded to host the circuit breakers inside the cubicle. The components are painted after welding. While the fabrication uses a CNC Turret press, painting is a manual job. The standard time required at the CNC turret press for fabricating a cubicle is 150 minutes and the time for the breaker housing is 36 minutes. A cubicle requires 43 square meters of area to be painted and breaker housing requires 2.60 square meters of painting. The standard time required to paint one square to paint one square meter of area is 18 minutes. The machines work at 80 percent efficiency and the manual labour works at 90 percent efficiency. Using the above data, computer the labour hour and machine hour requirements.
Solution: Capacity planning is done for the planning horizon. In our example, the basic data for the problem pertains to the planning horizon. The table below summarizes the data for further computations.
Since the demand during the planning horizon is the basis for computing the capacity requirement, we compute the demand using the data. Since eight cubicles are to be manufactured per day, in a year the required capacity is to fabricate 2440 (8 x 305 = 2440) cubicles. The table below shows the computation.
| Planning horizon | 1 Year |
| Number of working days in a year | 305 |
| Cubicles | Breaker housing | |
| Number per day | 8 | 13 |
| Demand per annum | 2440 | 3965 |
The standard time for fabricating one unit of cubicle and breaker housing are available. Also known is the efficiency of the machine. Using equation 2 we can therefore compute the machine hours required. The table below has the computations.
| Machine hour calculations | ||||
| Efficiency of CNC Turret Press | 80% | |||
| Cubicles | Breaker housing | Total | ||
| Machine hours required per unit | 2.50 | 0.60 | ||
| Machine hours required per annum | 7,625.00 | 2,973.75 | 10,598. 75 |
One can use equation 1 to compute the labour hours required in a similar manner. The table below shows the details of the computation.
| Labor hour calculations | ||||
| Efficiency of the workers | 90% | |||
| Standard man hours for painting 1sq.m | 0.30 | |||
| Cubicles | Breaker housing | Total | ||
| Square meters of area to be painted per unit | 43.00 | 2.60 | ||
| Total area to be painted during one year (sq.m) | 104,920.00 | 10,309.00 | 115,229.00 | |
| Labour hours required per annum | 34,973.33 | 3,436.33 | 38,409.67 |
Computing Capacity Availability: Once the capacity required is computed, one can estimate how much is already available in the system. By performing this computation and comparing with the requirements, one can identify the gaps or excess capacity available for each resource in question. The comparison of the available with the requirement serves several important purposes in a capacity planning exercise. Some of these worth mentioning are:-
- The comparison provides a basis to understand the comparison provides a basis to understand the consequence of the capacity expansion initiative to the operations manager.
- It helps to separate the resources into those with adequate capacity and insufficient capacity and help focus on the latter category for problem solving.
- It provides impetus for process plan changes and improvements for uncovering waste, and thereby discovering more capacity at some of the bottlenecks.
- Finally, it helps the manager to draw out capital budgeting and investment requirements of the capacity expansion initiative.
Availability of capacity in a system is a function of two parameters. One is the system availability and the second is the resource availability. System availability is a function of the number of working days and the number of hours per day. The number of hours in a day depends on operating policies pertaining to the number of shifts and overtime practices. Resource availability is a function of maintenance schedules and breakdown behavior of the resource (in the case of machines) and absenteeism (in the case of labour). Based on these, the capacity available in the system can be computed. The relevant computational details are as follows:
System availability
Number of working days in the planning horizon : Nd
Number of working hours per day : h
System availability (hours) =Nd x h
Resource availability’
Number of machines available : Nm
Machine: Time lost in breakdowns and maintenance = b%
Number of workers available : NL
Number of workers available : a%
Capacity available in the system
Machine : Nd x h x Nm x (1-b/100)
Labour : Nd x h x NL x (1-a/100)
Example: Consider the fabrications shop. Referred in this previous example Suppose the factory works on a two-shift basis with six workers in the paint shop. There is only one CNC turret press currently available. Suppose prior data shows that the equipment at the shop has a downtime of 12 percent and the absenteeism rate of the employees is 5 percent, assess the impact of the capacity expansion initiative in the plant.
Solution: The capacity requirements have already been computed in the previous example. They are as follows:-
Labour hours required at the paint shop : 38,409.67
Machine hours required at CNC Turret press facility : 10,598.75
Now let us compute the available capacity using equation 4.1.3. Table relevant computations are in the table below:
| Number of days in the planning horizon | 305 |
| Number of working hours per day | 16 |
| System availability (hours) | 4880 |
| Number of turret presses available | 1 |
| Percent of time lost in breakdown & maintenance | 12% |
| Capacity of CNC turret press available (hours) | 4,294.40 |
| Number of workers in the paint shop | 6 |
| Percent of time lost in absenteeism | 5% |
| Total labour hours available | 27,816.00 |
Comparison of Availability and Requirement
The table below shows the comparison between requirement and availability for the CNC Turret press and the labour in the paint shop. Since there is only 72 percent of the total requirement available in the paint shop, cubicles and breaker housing can be fabricated only to that extent (as shown in the table). Clearly, there is insufficient capacity in both these cases.
| Capacity Scenario (Hours) | ||||
| Requirement | Availability | Excess (Deficits) | Availability y (% of reqt.) | |
| Labour in paint shop | 38,409.67 | 27,816.00 | (10,593.67) | 72% |
| CNC Turret press | 10,598.75 | 4,294.40 | (6,304.35) | 41% |
| Present production capacity | Paint shop | Fabrication |
| Cubicles / day | 5.79 | 3.24 |
| Breaker Housings/day | 9.41 | 5.27 |
The firm needs to explore methods for augmenting this capacity to meet the revised capacity expansion initiative. One direct method is to compute the number of additional machines and labour required to meet the shortfall. Using the data already available, we can compute the number of additional hours that one can augment by adding one unit of labor on the machine. For example, one more worker will bring 4636 hours of work (305 days x 16 hours/day x 95 percent attendance). Using this information the number of additional machines and workers can be computed as shown in the table below.
| Number of hours of capacity added by one worker | 4,636.00 |
| Number of hours of capacity added by one CNC Turret Press | 4,294.40 |
| Additional workers required in the paint shop | 2.29=3 |
| Additional CNC Turret presses required | 1.47=2 |
Process Mapping and Capacity Analysis
What we have seen above is a detailed computation of the capacity requirement for a particular machine in the fabrication shop and the paint shop of the factory. However, the capacity of the fabrication shop is a function of the capacity of alternative resources available in the shop. Therefore, in order to understand the capacity of one stage of the production system (for example the paint shop) we need to understand the manner and the extent to which the available resources are utilized in manufacturing. One can obtain this information from a process mapping exercise. By process mapping, we mean a representation of all the available resources, the patterns and the extent to which each of these resources is being used. Using this information, we can compute the capacity of each resource available in the shop and the limiting capacity for the entire shop.
The process mapping exercise can be done at any level of abstraction and capacity implications are analyzed at that level of abstraction. Continuing with our example, the entire hierarchy of capacity computation could be graphically illustrated as in shown Figure 4.2.
We will consider an example to understand the capacity issues stemming from a process mapping exercise.
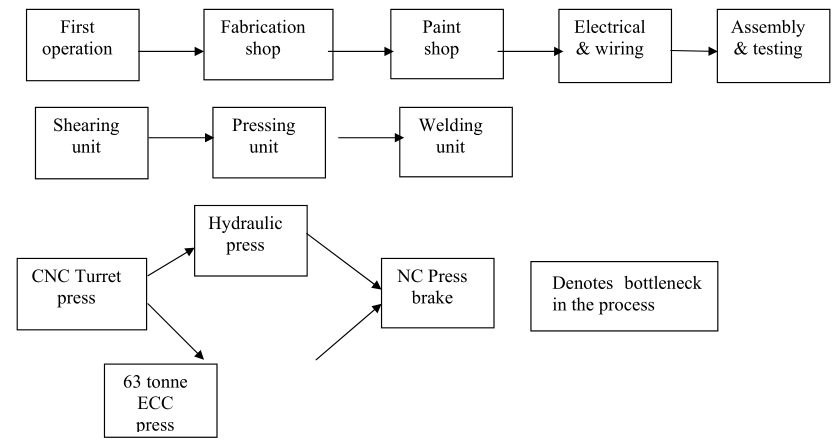
Fig. 4.2: Hierarchies in Capacity Estimation Exercise
Example: A product is manufactured in a shop using a five-stage process. The first step in the process is to cut the sheet metal to required shapes and sizes using a shearing process. After the shearing process, the components are subjected to pressing operations to alter the shape of the flat sheet as per the design. In the third stage of the process, welding is done to join the components. The next step in the process is a painting operation. After painting, the components are packed and kept ready for dispatch. The time taken for each of these operations is 20, 30, 15 and 6 minutes respectively. Presently, each stage has only one machine for operation. Map the process and analyze the capacity with respect to the following scenarios.
- If the shop works on an 8-hour shift with an effective available time of 450 minutes, what is the production capacity of the shop?
- Where is the bottleneck in the system? If we want to add one machine, where should we make the investment?
- Identify the additional capacity required for a daily production target of 25 units. Compute the utilization of the machines as per the revised capacity calculations.
- What are the key inferences of this exercise?
Solution: Based on the description given above, one can map the process and identify the extent of time the resources will be used at each stage of the process for manufacturing. The figures below have the process map. The numbers in parentheses denote the time required at each stage.
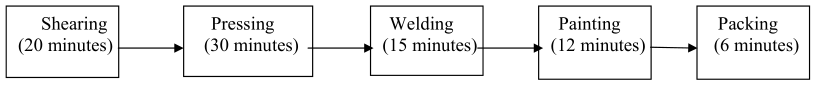
These timings can be translated into production capacities by dividing the total available time per shift with the required time at each stage. The production capacities are:
Shearing : 450/20 = 22.50
Pressing : 450/30 = 15.00
Welding : 450/15 = 30.00
Painting : 450/12 = 37.50
Packing : 450/6 = 75.00
The smallest number in the above calculation limits the production capacity for the shop. Therefore, the current production capacity is 15 units per day.
The slowest process is the bottleneck in the system and it dictates the production capacity. Therefore, it is prudent to channelize the investment at the bottleneck process. By adding one more machine, the situation changes as follows:
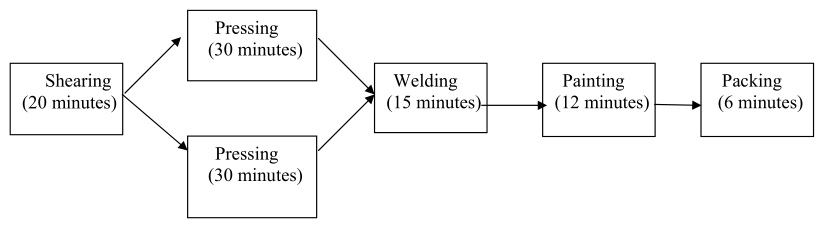
Since two machines are available at the pressing stage, the effective time per unit will now be 15 minutes. Therefore, the bottleneck now shifts to shearing and the revised production capacity will be 22.50 units a day.
The production target is now 25 per day. Since a day has 450 units, the maximum time that the process can take at each stage is 18 minutes. The packing, painting and welding sections have timings less than 15 minutes. Therefore, they do not need any more investment in capacity. By adding one more machine at the pressing stage, the effective time will be less than 18 minutes. Similarly, by adding one more machine at the shearing stage, the effective time will be 10 minutes. Using equation 4.1.3, the capacity utilization for the machines are as follows:
Daily production x process time = Utilization of shearing
Number of machines x available time
25 x 20
2 x 450 = 55.56%
Utilization of pressing = 25 x 30
2 x 450 = 83.33%
Utilization of welding = 25 x 15 = 83.33%
1 x 450
Utilization of painting = 25 x 12 = 66.67%
1 x 450
Utilization of packing = 25 x 6 = 33.33%
1 x 450
Key inferences: Computation of individual capacity availability and requirement is an important and the first step in the capacity planning exercise. The value of this exercise lies in our ability to use this information to identify bottlenecks. A process mapping exercise will help us achieve this objective. The utilization of the shearing process has dropped to 56 percent due to the addition of a machine. Clearly, addition of one more unit of resource may not always be the best always be the best solution.
Alternatives for Capacity Augmentation
The previous example pointed out the need for looking at alternative methods for capacity augmentation during a capacity planning exercise. The straightforward option is to add more units of resource. Although it is simple from an operational decision making point of view, in reality the implications, could be far too many. The cost of the resource in question, the utilization of the resource and the ease of implementation of the capacity expansion plan are some of the issues that will influence the choice of this option. Moreover, as more and more units of resources are added, it may significantly impact the long term operational costs of the system. For example, if several new workers are added, then the cost of the system increases not merely in terms of salary but also in terms of support costs, benefits, health and post-retirement provisions. Similarly, as more machines are added, equipment maintenance costs will go up in the long run. Furthermore, if the resource in question is very expensive and the utilization of resource is likely to be low, it is very unattractive and operations managers should look of other options.
Waste Elimination
One method to increase the capacity of the resources in the system is to employ Japanese methods of resources planning and management, as described earlier in the chapter. In a nutshell, it is for the operations manager to make use of eq1uation 4.1.3 and progressively uncover capacity from the system by elimination of waste. Process industries increase capacity by de-bottlenecking operations. Since in process industries, the system is a continuous flow of material from the raw material to finished goods, merely identifying the bottleneck stage in the process and de-bottlenecking it can increase the capacity of the system. Japanese approaches to waste elimination and /or addition of fresh capacity is that stage will increase the capacity of the system. However, the bottleneck will shift elsewhere and the process could be repeated.
Multi-skilling of Work Force
Another approach to increasing capacity is by multi-skilling of the work force. Often, capacity constraints manifest on account of non-availability of shills even when adequate capacity is available in machines and other resources. For instance, in a machine shop, there will be enough drilling machines, grinding machines, gear cutting machines and CNC machines to process all the requirements. However, if the workforce is not multi-skilled, then production may suffer on account of a specific set of skills not being available at some time. There may be just a few workers who can operate the gear cutting machine and the CNC machine. Therefore, these workers will dictate the capacity of the system. On the other hand, if all the workers have skills, to operate all the machines, then it is much easier to absorb fluctuations in both demand and workforce availability.
Multi-skilling not only solves the problem of providing each operating unit or a subdivision with the required skills but also increases the flexibility of operating such units. Employee absenteeism does not affect the working seriously. At the shop floor level, multi-skilling in a machine shop would mean picking up the skills required for operating all the machines and in the assembly shop it would mean working at all stages of assembly. In the fabrication shop it would call for proficiency in fitting, welding, shearing etc. On the other hand, at the supervisory level and shop floor managerial level, it would mean discharging various manufacturing support functions such as production planning and control, inventory and stores management and procurement.
Developing multi-skilling is an easy but time bound programme in any organization. The management needs to focus adequate attention on this aspect and encourage employees to acquire, in addition to the skill required for processing at his/her work place, the skill to perform the preceding and the succeeding stages of processing. That is a good way to start the process. However, in order to get a sense of direction in this process, organizations need to conduct a skill inventory at every shop. The skill inventory could be used to compute some indices that describe the current status of multi-skilling in the shop. Once this information is available, the management could chalk out various training programmers to help employees in each shop to pick up critical and scarcely available skills first.
It also helps to set up measurement system to keep track of the extent to which employees have acquired additional skills. The advantage of a measurement system lies in its usefulness in setting up targets for achieving improvements over a period of time. The multi-skilling index is a potential candidate for such a measurement system (Table 4.1.). Once the current index is established, it serves as a baseline over which further improvements could be made. Quarter-wise or half-yearly targets can be set up and used for reviewing the progress in the process.
The information presented to Table 4.1. Can be used in different ways. For example, for each skill required in each shop, the number of people trained could be identified. Such an analysis would help in identifying the critical skills and those that are not currently available. In Table 4.1, it may be seen that skill 4 is critical as only one employee has acquired it. Using such information, shop workers can be encouraged to gravitate towards the required critical skills
It is also possible to display the above information on a board and use it as a visual control aid. Once such example was found in a two-wheeler manufacturer in South India, who made use to visual aids for measurement of multi-skilling as a part of the shop information system, the list of employees and the skills that they were proficient in was displayed. As and when an employee acquires and additional skill, the display board was updated. For each employee belonging to a particular shop, a solid circle against a skill would indicate that he had acquired the skill and a hollow circle, otherwise. Displaying the multi-skilling chart on board will have a positive impact on the work force. While those who have acquired a large number of skills experience a sense of satisfaction and pride and aspire to reach the best possible stage, others with proficiency just one or two skills experience an implicit psychological pressure to improve.
Table 4.1
| Sample skill inventory matrix and multi-skilling index | |||||
| S. No. | Employee Name | Skill 1 | Skill 2 | Skill 3 | Skill 4 |
| 01 | Datta K N | No | No | Yes | No |
| 02 | Bhokare S B | No | No | Yes | No |
| 03 | Mense A N | No | Yes | No | No |
| 04 | D’Souza A J | Yes | No | No | No |
| 05 | Shriram C R | Yes | Yes | No | Yes |
| 06 | Chidre Y M | No | No | Yes | No |
| 07 | Raskar S N | No | No | Yes | No |
| 08 | Narke B R | Yes | Yes | No | No |
| 09 | Karanjia K R | No | Yes | No | No |
| Maximum number skills that could be acquired in the shop = 36 Number of skills the employees currently possess = 12 Multi-skilling index for the shop = 33% |
Sub-contracting/Outsourcing
Capacity augmentation need not be done in-house always. An alternative approach to capacity augmentation is to sub-contracting decision closely follows that of a “make or buy” decision that purchase managers and management accountant address in their respective domains. Several considerations influence the sub-contracting decisions in firms. Primary among them is the lack of capacity to meet the current demand. The other consideration is the technological intensity and criticality of the item for which capacity is being sub-contracted. When the item is of low technical intensity and criticality, then it is less risky to sub-contract capacity. The firm may not lose any valuable trade secret or know-how pertaining to the product being manufactured. The third issue is one of cost. When the cost of performing an activity in-house is much higher than what is available outside, then it is appropriate to outsource such activities and use the released capacity for other important activities.
Sub-contracting offers several advantages to a firm. First is the flexibility to handle fluctuations in demand. By investing in capacity in house, the firm may run the risk of under- utilization should the demand for the product/service come down in the future. In -house capacity augmentation is a time consuming process. On the other hand, firms can react much faster to market requirements by using sub-contracting. Sub-contracting is also very useful to manage peak hour demand. By having an in-house capacity equal to the average demand during period, firms can address peak hour requirement using sub-contracting.
Despite these advantages, sub-contracting has some drawbacks. The major challenge in sub- contracting is to identify an appropriate vendor for providing sub-contracted services. If the selection of the vendor is not done carefully, poor performance of the vendors will impact adversely the firm’s business and market standing.
Capacity utilization: Capacity utilization is the degree to which equipments currently being used. It is expressed as under;
Utilization= Average output * 100 %
Maximum capacity
The units of measurement for both numerator and denominator should be the same. Though the capacity utilization can be measured by the equation given above but it is difficult to measure the effective capacity utilization. There are day to day variations, job changes, product mix changes, absenteeism, equipment breakdown, facility down time etc. Due to these variations, the capacity of a facility can rarely be measured in precise terms. It is found that an organization can operate more efficiently when its resources are not stretched beyond a limit. Capacity is the capacity, which a firm can expect to achieve, given its product mix, method of scheduling, maintenance and standard of quality. Thus
Expected capacity
Effective capacity utilization = ———————
Capacity-
Efficiency is a measure of actual output over effective capacity and is expressed as a percentage of effected capacity.
Actual output
Efficiency = ————————-
Effective capacity
A rated capacity is a measure of the maximum usable capacity of a particular facility
Rated capacity = (capacity)’ (utilization)’ (efficiency)
For example, one facility has an efficiency of 90%and utilization is 80%. Three product lines are used to produce the product. The lines operate 6 days a week and three 8-hrs shifts; each line was designed to produce 100 standard units per hour. The rated capacity is
Rated capacity = (capacity)’ (utilization) ‘(efficiency) ‘
= (100)’ (3)’ (144)’ (0.8) ‘(0.9)
=31,104 products /week
