Cluster analysis- Cluster analysis is a class of statistical techniques that can be applied to data that exhibits “natural” groupings. Cluster analysis sorts through the raw data and groups them into clusters. A cluster is a group of relatively homogeneous cases or observations.
Objects in a cluster are similar to each other. They are also dissimilar to objects outside the cluster, particularly objects in other clusters. The diagram below illustrates the results of a survey that studied drinkers’ perceptions of spirits (alcohol). Each point represents the results from one respondent. The research indicates there are four clusters in this market.
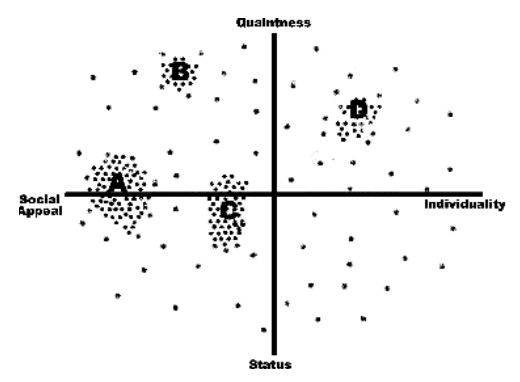
The diagram shows a study of consumers’ ideal points in the alcohol/spirits product space. Each dot represents one respondent’s ideal combination of the two dimensions. Areas where there is a cluster of ideal points (such as A) indicates a market segment. Areas without ideal points are sometimes referred to as demand voids.
Perceptual Map of Ideal Points and Clusters
Another example is the vacation travel market. Recent research has identified three clusters or market segments. They are the – 1) The demanders – they want exceptional service and expect to be pampered; 2) The escapists – they want to get away and just relax; 3) The educationalist – they want to see new things, go to museums, go on a safari, or experience new cultures.
Cluster analysis, like factor analysis and multi dimensional scaling, is an interdependence technique – it makes no distinction between dependent and independent variables. The entire set of interdependent relationships is examined. It is similar to multi dimensional scaling in that both examine inter-object similarity by examining the complete set of interdependent relationships. The difference is that multi dimensional scaling identifies underlying dimensions, while cluster analysis identifies clusters. Cluster analysis is the obverse of factor analysis. Whereas factor analysis reduces the number of variables by grouping them into a smaller set of factors, cluster analysis reduces the number of observations or cases by grouping them into a smaller set of clusters.
In marketing, cluster analysis is used for –
- Segmenting the market and determining target markets
- Product positioning and New Product Development
- Selecting test markets (see – experimental techniques)
Factor analysis – Factor analysis is a statistical approach that can be used to analyze interrelationships among a large number of variables and to explain these variables in terms of their common underlying dimensions (factors). The statistical approach involving finding a way of condensing the information contained in a number of original variables into a smaller set of dimensions (factors) with a minimum loss of information. The objective is to discover patterns among variations in the values of multiple variables. This is done by generating artificial dimensions (called factors) that correlate highly with the real variables. The basic steps are –
- Identify the salient attributes consumers use to evaluate products in this category.
- Use quantitative marketing research techniques (such as surveys) to collect data from a sample of potential customers concerning their ratings of all the product attributes.
- Input the data into a statistical program and run the factor analysis procedure. The computer will yield a set of underlying attributes (or factors).
- Use these factors to construct perceptual maps and other product positioning devices.
Discriminate analysis – Discriminate analysis is a statistical technique used in marketing and the social sciences. It is applicable when there is only one dependent variable but multiple independent variables (similar to ANOVA and regression). But unlike ANOVA and regression analysis, the dependent variable must be categorical. It is similar to factor analysis in that both look for underlying dimensions in responses given to questions about product attributes. But it differs from factor analysis in that it builds these underlying dimensions based on differences rather than similarities. Discriminate analysis is also different from factor analysis in that it is not an interdependence technique – a distinction between independent variables and dependent variables (also called criterion variables) must be made.
