There is information that cannot be seen on web page front end. But if you want to know really what is happening if your open any webpage you can inspect elements.
Few features that you can find the information about web page by inspecting the page or any particular element available in the page usually includes style, ids of a web element. HTML information of any element can be found by clicking on Element. The Network information can list the status of the response whether it is OK or any Error. Using console any error occurring during page load in the browser, can be accessed.
Web browsers provided tools to inspect web elements of a web page. Plug-ins like Firebug also provides same functionality.
Chrome DevTools
The Chrome Developer Tools (DevTools for short), are a set of web authoring and debugging tools built into Google Chrome. The DevTools provide web developers deep access into the internals of the browser and their web application. Use the DevTools to efficiently track down layout issues, set JavaScript breakpoints, and get insights for code optimization.
To access the DevTools, open a web page or web app in Google Chrome – Select the Chrome menu Chrome Menu at the top-right of your browser window, then select Tools > Developer Tools or Right-click on any page element and select Inspect Element. The DevTools window will open at the bottom of your Chrome browser.
There are several useful shortcuts for opening the DevTools:
- Use Ctrl+Shift+I (or Cmd+Opt+I on Mac) to open the DevTools.
- Use Ctrl+Shift+J (or Cmd+Opt+J on Mac) to open the DevTools and bring focus to the Console.
- Use Ctrl+Shift+C (or Cmd+Shift+C on Mac) to open the DevTools in Inspect Element mode, or toggle Inspect Element mode if the DevTools are already open.
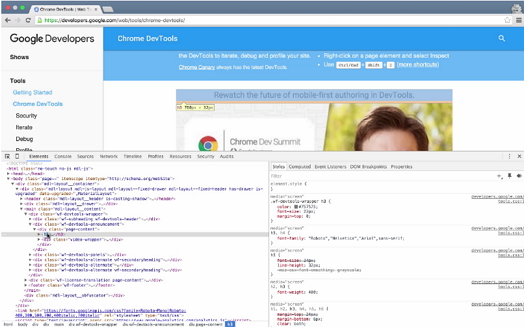
The DevTools are organised into task-oriented groups in the toolbar at the top of the window. Each toolbar item and corresponding panel let you work with a specific type of page or app information, including DOM elements, resources, and sources.
Overall, there are eight main groups of tools available view Developer Tools – elements, resources, network, sources, timeline, profiles, audits and console. You can use the Ctrl+[ and Ctrl+] shortcuts to move between panels.
The Elements panel lets you see everything in one DOM tree, and allows inspection and on-the-fly editing of DOM elements. You will often visit the Elements tabs when you need to identify the HTML snippet for some aspect of the page. For example, you may be curious if an image has an HTML id attribute and what the value is.
Internet Explorer and Edge
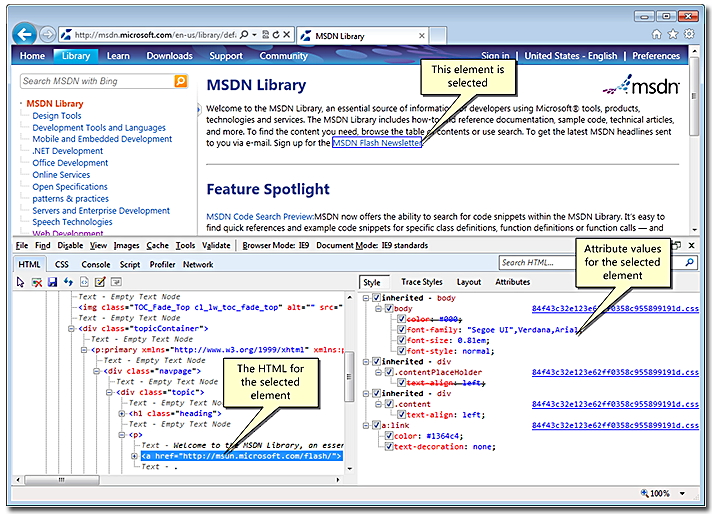
Like Google Chrome, Internet Explorer also has its own Developer Tool that can be used to identify web elements based on their properties within the web page. The user is not required to download or install any separate plugin, the developer tool comes readily bundled with Internet Explorer.
F12 tools are available on any page you are viewing from within Internet Explorer 9 by pressing F12, or by clicking the tools button of the Internet Explorer tools button, and then selecting F12 tools. F12 tools opens in a separate window, but you can pin it to the page you’re working with by clicking the pin button or pressing Ctrl+P. Note that the window cannot be pinned while debugging on the Script tab (Start debugging has been clicked).
If you do not need the complete tools interface, click the Minimize button or press Ctrl+M after the tools are pinned. The tools become a row at the bottom of the window, providing access to the Command Menu bar.
The F12 tools are loosely broken into two areas, page and visual based tools, and code level or debugging tools. The page and visual tools are accessed mostly by using the main menu or shortcut keys. These tools complete tasks such as creating reports of all the links in your document, or visually outlining a specific element on a page.
The code level tools are accessed through six dedicated tabs that provide HTML, CSS, and script debugging, as well as code profiling and network traffic capturing. The Console tab offers a way to receive and view messages that you can send from within your code using the console commands.
From most views in F12 tools, you can click attributes and variables to change the values, and type in a new value. In the CSS tab, you can toggle styles and rules by selecting or clearing check boxes.
You can type a specific tag, ID, element, variable, or string into the Search box and press Enter to find that item within a webpage code or details (such as under an expanded list of properties on the script tab). All found items are highlighted in the current view, and searches can be done on all but the Console tab or console view on the Script tab.. For the Network tab, if you’re in the Summary view, search opens the Details view and shows search results across all categories. In the Script tab, you can also search across all the script files being used for your page, not just the one being displayed.
When you have multiple hits, you can navigate between them by pressing Enter or Shift + Enter, or click the Next or Previous result buttons.
![]()
To make finding specific elements in a large DOM tree, you can select individual elements in the browser, and have them highlighted in the HTML tab of the F12 tools. From the F12 tools debugging window, click the Select Element by Click button Picture of the Select Element by Click button, or press Ctrl + B to highlight elements on the webpage as you hover on the page. When you click a highlighted element, the HTML tab will open and scroll to the selected element in the code pane. In some situations, you might need to refresh the HTML tab to see the element.
Edge Browser
The Microsoft Edge F12 DevTools are built with TypeScript, powered by open source, and optimized for modern front-end workflows.
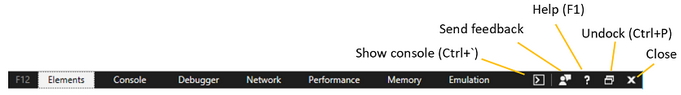
The Microsoft Edge F12 DevTools include:
- An Elements panel to edit HTML and CSS, inspect accessibility properties, view event listeners, and set DOM mutation breakpoints
- A Console to view and filter log messages, inspect JavaScript objects and DOM nodes, and run JavaScript in the context of the selected window or frame
- A Debugger to step through code, set watches and breakpoints, live edit your code, and inspect your web storage and cookie caches
- A Network panel to monitor and inspect requests and responses from the network and browser cache
- A Performance panel to profile the time and system resources required by your site
- A Memory panel to measure your use of memory resources and compare heap snapshots at different states of code execution
- An Emulation panel to test your site with different browser profiles, screen resolutions, and GPS location coordinates
Safari Browser
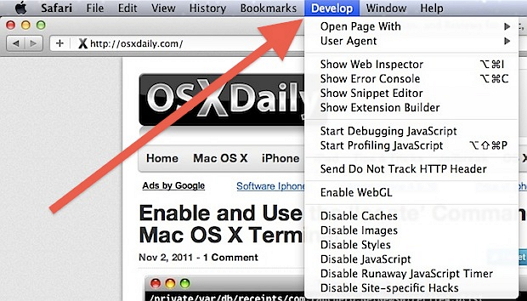
The Safari Develop menu provides tools you can use to make sure your website works well with all standards-based web browsers. If you don’t see the Develop menu in the menu bar, choose Safari > Preferences, click Advanced, then select “Show Develop menu in menu bar.”
The table below lists the commands in the Develop menu.
| Option | Description |
| Open Page With | Opens the displayed webpage using another web browser installed on your computer, as listed in the submenu. |
| User Agent | Changes the User Agent header included with outgoing HTTP requests. Use this option to “spoof” the web server into thinking that you’re using a different browser, operating system, or version of Safari, so you can investigate whether the server is providing different content under varying conditions. |
| Enter Responsive Design Mode | Responsive Design Mode provides a unified interface for designing web experiences across various screen sizes and orientations. Use this option to quickly preview your web content with a variety of different screen sizes (including those for Apple devices and custom viewports) and User Agents. |
| Show Snippet Editor | Lets you quickly test small fragments of HTML and CSS without opening an entire webpage. |
| Show Web Inspector | Web Inspector provides a unified interface to inspect, debug, and improve web content. Use it to view the resources, timelines, source code, debugger, and console messages for web content. |
| Show JavaScript Console | Shows the Console in Web Inspector. Use it to test JavaScript using the Command Line API. The console displays security problems, syntax errors, JavaScript exceptions, and messages logged by the inspected web content/JSContext using the Console API. |
| Show Page Source | Shows the HTML source code for the main frame of the displayed webpage.
To search the source code, click anywhere in the code, press Command-F, then enter a word or phrase in the search field that appears in the Source Code pane. |
| Start Element Selection | Allows you to select any DOM element on the current webpage with a light blue selector box. |
| Empty Caches | Empties the network cache and other Safari caches. |
| Disable Caches | Retrieves a subresource from the web server each time the subresource is accessed, rather than using a cached copy. |
Mozilla Firefox
The Web developer option under Tools menu, has various tools for web development and testing.
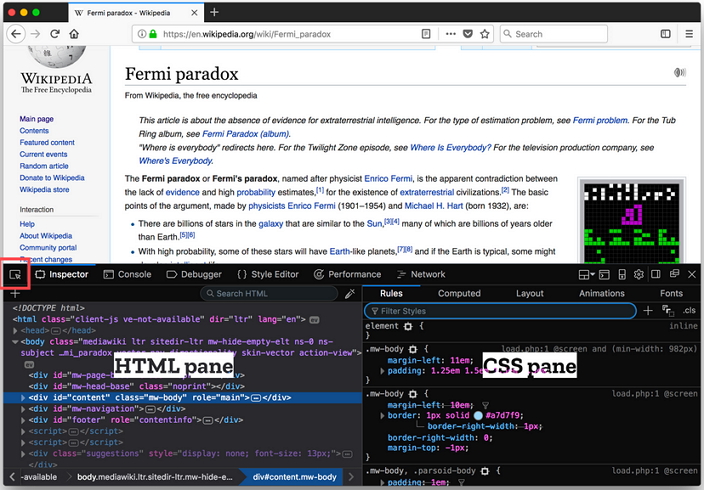
The Inspector is used to examine and modify the HTML and CSS of a page. There are two main ways to open the Inspector
- without an element selected: choose “Tools -> Web Developer -> Inspector” from the Menu Bar or the equivalent keyboard shortcut
- with an element selected: right-click an element on a web page and select “Inspect Element”
Various tools in Firefox are
- The Inspector gives you detailed information about the currently selected element. The Select element button is one way you can select an element for inspection.
- The Web Console logs information associated with a web page: network requests, JavaScript, CSS, security errors and warnings as well as error, warning and informational messages explicitly logged by JavaScript code running in the page context. It also enables you to interact with a web page by executing JavaScript expressions in the context of the page
- The JavaScript Debugger enables you to step through JavaScript code and examine or modify its state to help track down bugs.
- The Network Monitor shows you all the network requests Firefox makes (for example, when it loads a page, or due to XMLHttpRequests), how long each request takes, and details of each request.
- The Performance tool gives you insight into your site’s general responsiveness, JavaScript and layout performance. With the Performance tool you create a recording, or profile, of your site over a period of time. The tool then shows you an overview of the things the browser was doing to render your site over the profile, and a graph of the frame rate over the profile.
Firebug and FirePath
Both Fire bug and Firepath are plug ins of Mozilla Firefox browser but are not compatible to the new version. Both needs to be installed from Firefox plug in website and Firefox needs to be restarted. Both were used with Selenium IDE to create Selenium tests.
Firebug integrates with Firefox to put a wealth of development tools at your fingertips while you browse. You can edit, debug, and monitor CSS, HTML, and JavaScript live in any web page.
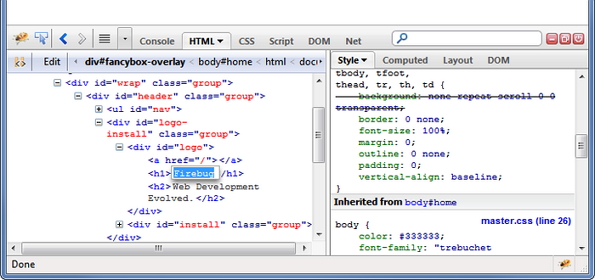
FirePath is a Firebug extension that adds a development tool to edit, inspect and generate XPath 1.0 expressions, CSS 3 selectors and JQuery selectors (Sizzle selector engine).
