Gantt Chart
A Gantt chart is one of the common methods used in project management. It is one of the useful ways of showing activities displayed against time. The left side of the chart represents a list of the activities and along the top is a suitable time scale. Each activity is represented by a bar. In other words, the position and length of the bar reflect the start date, duration and end date of the activity.
Key Parts
Gantt involves several different elements. Therefore, let’s take a quick look at 8 key components so you know how to read a
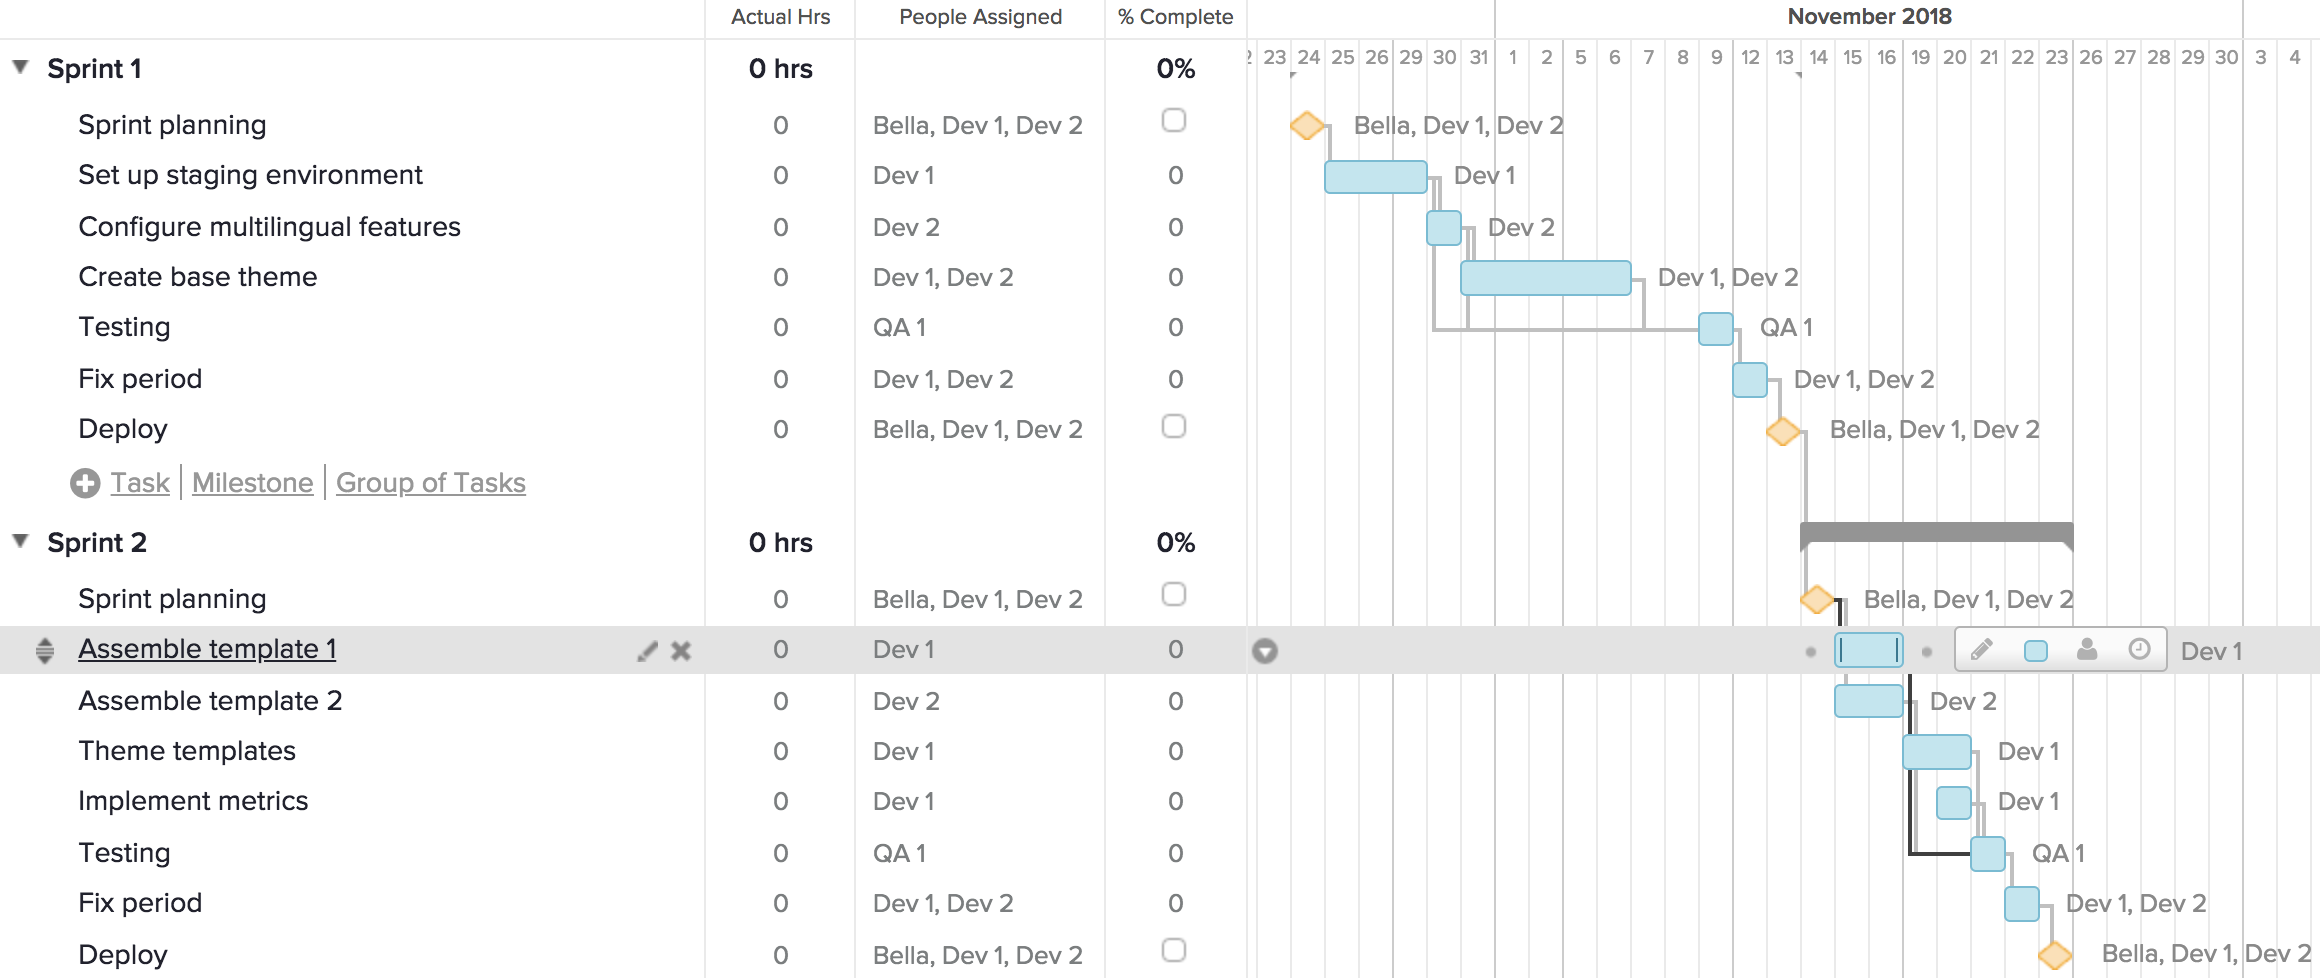
- Tasklist: Firstly, runs vertically down the left of the Gantt chart. It describes project work into groups and subgroups
- Timeline: Secondly, the timeline runs horizontally across the top of the Gantt chart. It shows months, weeks, days, and years
- Dateline: After that, dateline is a vertical line which highlights the current date on the Gantt chart
- Bars: Bars are the horizontal markers present on the right side of the represent tasks. It shows progress, duration, and start and end dates
- Milestones: They are the yellow diamonds which call out major events, dates, decisions, and deliverables
- Dependencies: Light gray lines that connect tasks that need to happen in a certain order
- Progress: It shows how far along work is. It is generally shown by % Complete and/or bar shading
- Resource assigned: Lastly, it indicates the person responsible for accomplishing a task
Get certified and unlock more opportunities. Practice and Validate your skills to become a Certified Agile Testing Professional Now
