
Add-ins are a feature in Microsoft Excel that provide additional features and commands. Two of the more popular add-ins are the Analysis ToolPak and Solver, both of which provide extended data analysis capability for “what-if” planning. To use these add-ins, you need to install and activate them.
If you need to develop complex statistical or engineering analyses, you can save steps and time by using the Analysis ToolPak. You provide the data and parameters for each analysis, and the tool uses the appropriate statistical or engineering macro functions to calculate and display the results in an output table. Some tools generate charts in addition to output tables.
The data analysis functions can be used on only one worksheet at a time. When you perform data analysis on grouped worksheets, results will appear on the first worksheet and empty formatted tables will appear on the remaining worksheets. To perform data analysis on the remainder of the worksheets, recalculate the analysis tool for each worksheet.
To access tools of the Analysis ToolPak, click Data Analysis in the Analysis group on the Data tab. If the Data Analysis command is not available, you need to load the Analysis ToolPak add-in program.
Install and activate the Add-ins
- Click the File tab.
- Click Options, and then click the Add-Ins category.
- Near the bottom of the Excel Options dialog box, make sure that Excel Add-ins is selected in the Manage box, and then click Go.
- In the Add-Ins dialog box, select the check boxes for Analysis ToolPak and Solver Add-in, and then click OK.
- If Excel displays a message that states it can’t run this add-in and prompts you to install it, click Yes to install the add-ins.
Get started using the Analysis ToolPak
- On a worksheet, click a cell.
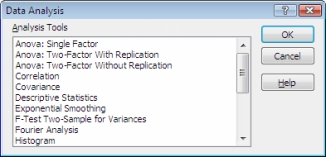
- On the Data tab, in the Analysis group, click Data Analysis.
- In the Data Analysis dialog box, click the tool that you want to use and click OK.

- In the dialog box that appears for the tool you chose, enter the parameters and select any options as needed.
Solver
Solver is part of a suite of commands sometimes called what-if analysis tools. With Solver, you can find an optimal (maximum or minimum) value for a formula in one cell — called the objective cell — subject to constraints, or limits, on the values of other formula cells on a worksheet. Solver works with a group of cells, called decision variables or simply variable cells, that participate in computing the formulas in the objective and constraint cells. Solver adjusts the values in the decision variable cells to satisfy the limits on constraint cells and produce the result you want for the objective cell.