Process Capability and Performance
Process capability and performance is a predictable pattern of statistically stable behavior where there is a comparison of variation cause with the engineering specifications. Moreover, a capable process is a process whose spread on the curve in bell-shape is narrower than the tolerance range.
Process Capability Studies
- A process capability study attempts to measures whether a process can consistently meet the standards set by internal or external customers. Moreover, measuring capability can be challenging because it is, by definition, a point estimate.
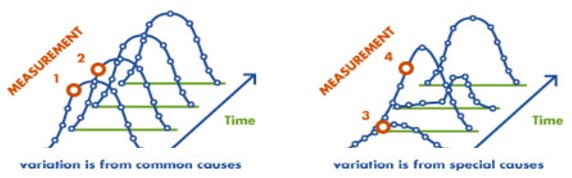
- Moreover, if the variation is due to a common cause, the output will still form a distribution that is relatively stable as the variation is constant.
- In this case, a process capability study may be completed but, if the variation is a result of a special cause, then the output is not as stable and not as predictable.
Developing Sampling Plans
If the process fits a normal distribution and is in statistical control, then the standard deviation can be estimated from,

Specification Limits
Specification limits are set by the customer and result from either customer requirements or industry standards.
Moreover, the amount of variance, the customer is willing to accept sets the specification limits. And, if the process is not meeting the customer’s specification limits, two choices exist to correct the situation:
- Changing the process’s behavior.
- Change the customer’s specification after the customer’s approval.
Process Limits
- Process limits are the voice of the process based on the variation of the products produced. Moreover, the supplier collects data over time to determine the variation in the units against the customer’s specification. And, collecting these data points over time establishes the process curve.
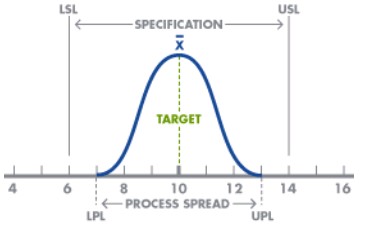
Above all, having a predictable process producing 100 percent conformances is the ideal state. Moreover, control charts are special types of time series charts in which calculations of control limits are around the central location, or mean. Below you can see a process capability diagram,
Process Performance Metric
It is a measure of an organization’s activities and performance and includes metrics like percentage defective which is defined as the (Total number of defective parts)/(Total number of parts) X 100. So, if there are 1,000 parts and 10 of those are defective, the percentage of defective parts is (10/1000) X 100 = 1%.
Process capability indices
The process capability list includes Cp and Cpk. Moreover, it identifies the current state of the process and provides statistical evidence for comparing after-adjustment results to the starting point.
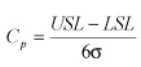
Cp:
Cp measures the ratio between the specification tolerance (USL-LSL) and the ess spread. Whenever a process that is normally distributed and is exactly mid-way between the specification limits, it yields a Cp of 1 if the spread is +/- 3 standard deviations. Moreover, the minimum value for Cp is 1.33. It is computed as,
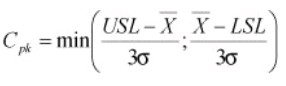
Cpk:
Cpk measures the absolute distance of the mean to the nearest specification limit. Usually, a Cpk value of a minimum of 1 and a maximum of 1.33 is desirable. Along with Cp, Cpk provides a common measurement for assigning an initial process capability to center on specification limits. It is computed as
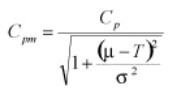
Cpm
Cpm is also referred to as the Taguchi index. Moreover, it is more accurate and reliable than the other indices. And, it focuses on reducing the variation from a target value (T). Above all, Cpm provides a common measurement assigning an initial process capability to a process for aligning the mean of the sample to the target. It is computed as,
Sigma and Process Capability
When means and variances wander over time, a standard deviation (σ) is the most common way to describe how data in a sample varies from its mean.
To compute sigma (σ), use the following equation for a population
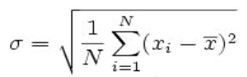
With, N is the number of items in the population, ![]() is the mean of the population data and x is each data point.
is the mean of the population data and x is each data point.
Computing Cp and Cpk
Process capability is a technique to find out the measurable property of a process to a specification. Generally, the final solution of the process capability is either in the form of calculations or histograms. Moreover, the process capability index (cpk) is the measure of process capability.
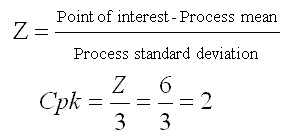
Converting from Cpk to a Z-score
With a normal distribution, set of data an approximation of Z from Cpk and vice versa can be made in substituting and solving within these two formulas. The formulas are,
Process Performance Indices
The most used process performance indices are Pp, Ppk, and Cpm which depict the present status of the process and also act as an important tool for improvement of the process. Moreover, these metrics have a common purpose as process capability indices but, they differ in their approach.
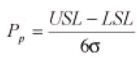
Pp
Pp measures the ratio between the specification tolerance and process spread. It helps to measure improvement over time as it signals where the process is in comparison to the customer’s specifications.
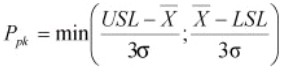
Ppk
It measures the absolute distance of the mean to the nearest specification limit. Moreover, it provides an initial measurement to center on specification limits. And, it also examines variation within and between subgroups.,
Short-term capability
- Short-term capability measurement is done over a very short time period since it focuses on the machine’s ability. That includes the design and quality of construction.
- Moreover, short-term capability uses a finite amount of data relative to a short time and the number of pieces produced to remove the effects of long-term components.
- And, when there is process capability determination using one operator on one shift, with one piece of equipment, the process variation is relatively small.
Process Capability for non-normal data
Although effective analysis of data that does not have normal distribution is possible, completing one of the action steps below. Moreover, it is beneficial for some projects to create a more useful data set,
- Firstly, divide the data into subsets according to business sub-processes.
- Then, mathematically transform the data and specification limits.
- After that, turn the continuous data into discrete data.
The process capability calculation is based on
- The mean of the sample.
- The standard deviation of the sample.
- The known characteristics of the distribution.
The second stream of PCI research has five groups,
- Firstly, data transformation methods.
- Then, Development of quality control procedures for certain non-normal distributions.
- After that, distribution fitting for empirical data.
- Development of distribution-free procedures.
- Lastly, the construction of new PCIs.
The Box-Cox power transformations
Formula is,
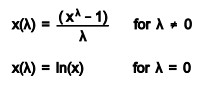
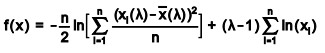
Given data observations x1, x2, …xn, select the power /\ that maximizes the logarithm of the likelihood function
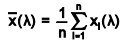
The arithmetic mean of the transformed data is,
Process capability for attributes data
The capability refers to the average proportion or rate of nonconforming products for attribute charts.
- Firstly, for p charts, the process capability is the process average nonconforming,
 .The proportion conforming to the specification, 1- , may be used.
 - Then, for np charts, the process capability is the process average non-conforming, .
- For c charts, the process capability is the average number of nonconformities,
 , in a sample of fixed size n.
 - Lastly, for u charts, the process capability is the average number of nonconformities per reporting unit,
 .
.
Learn and enhance your Process Capability and Performance skills. Become a Certified TQM Professional Now!
