Measures of Spread
Lets us understand Measures of Spread. Although the average value in distribution is centered in the distribution, the mean, median, and mode lack context for interpreting those statistics. Also, measures of variability provide information about the degree. This is according to individual scores which are clustered.
Measures of Spread: Range
The simplest measure of variability to compute and understand is the range. Moreover, the range is the difference between the highest and lowest score. Moreover, it is not often used as the sole measure of variability due to its instability. Because it does not fully reflect the pattern of variation within a distribution, and the range is a very limited measure of variability.
Measures of Spread: Inter-quartile Range (IQR)
IQR means 5th percentile – the 25th percentile and provides a measure of the spread of the middle 50% of the scores. Above all, the interquartile range plays an important role in the graphical method known as the boxplot. And, the advantage of using the IQR is that it is easy to compute and extreme scores in the distribution have much less impact. Moreover, the boxplot is an important tool for exploring data.
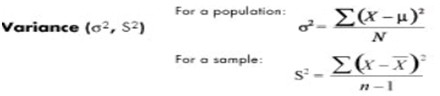
Variance (σ2)
The variance is a measure that depends on the deviations of individual scores from the mean. Hence, the variance is a squared deviation of scores about the mean. And, when the deviations are squared, the rank order and relative distance of scores in the distribution get preserve with elimination the negative values. As a result, it gives average of the sum of the squared deviations known as the variance.
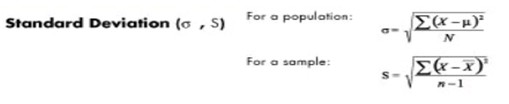
Standard deviation (σ)
The standard deviation refers to the positive square root of the variance and is a measure of variability in the same units as the data. Moreover, the standard deviation is very much like a mean or an “average” of these deviations. And, in a normal distribution, about two-thirds of the scores fall between +1 and -1 standard deviations from the mean. Moreover, the standard deviation is approximately 1/4 of the range in small samples (N < 30) and 1/5 to 1/6 of the range in large samples (N > 100).
Coefficient of variation (cv)
Measures of variability is not like the standard deviation of the production of bolts to the availability of parts. However, if the standard deviation for bolt production is 5 and for the availability of parts is 7 for a given time frame. Thus, variability is greater with the parts. Hence, the coefficient of variation is the ratio of the standard deviation to the mean. It is cv = σ / µ for a population and cv = s/ for a sample.
Get ready to boost your learning and prepare for Certified TQM Professional. Practice and Prepare for Measures of Spread Now!
