
Decision models are used to model a decision being made once as well as to model a repeatable decision-making approach that will be used over and over again. Development of decision model follows in various steps i.e. formulating, evaluating, appraising and refining a model.
The various steps are listed as
- Formulation – Formulation is the first and often most challenging stage. The objective of the formulation stage is to develop a formal model of the given decision. This may be represented as a network of decision-making elements, as a decision tree or in other ways depending on the specific situation. The formulation may be conceptual or may include all the necessary decision logic (business rules) required to define the decision-making.
- Evaluation – For a decision being made once, the objective of the evaluation stage is to produce a formal recommendation (and its associated sensitivities) from a formal model of the decision situation. For a repeatable decision evaluation occurs each time the decision is made by applying the decision model that has been developed.
- Appraisal – The objective of the appraisal stage is for the decision maker to develop insight into the decision and determine a clear course of action. Much of the insight developed in this stage results from exploring the implications of the formal decision model developed during the formulation stage (i.e., from mining the model). Possible actions following the appraisal stage include implementing the recommended course of action, revising the formal model and reevaluating it, or abandoning the analysis and doing something else.
- Refinement – The refinement stage responds to the insights obtained during the Appraisal stage. Effective refinement activities include opportunities to test possible decision model changes to see their implications and suggest better ways to modify the decision model.
Various approaches for problem solving are used, which includes
Graphical models
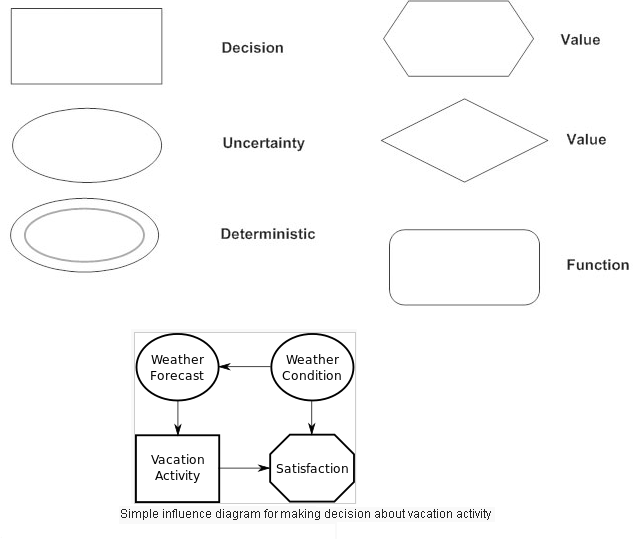
They graphically depict the various elements of the problem and their relationships as with the usage of influence diagrams. An influence diagram (ID) (also called a relevance diagram, decision diagram or a decision network) is a compact graphical and mathematical representation of a decision situation. It is a generalization of a Bayesian network, in which not only probabilistic inference problems but also decision making problems (following maximum expected utility criterion) can be modeled and solved.
Closely related to decision trees and often used in conjunction, influence diagrams are a summary of information contained in a decision tree. They involve 4 variable types for notation: a decision (a rectangle), chance (an oval), objective (a hexagon), and function (a rounded rectangle). Influence diagrams also use solid lines to denote influence. Their appearance is very similar to a flowchart.
Influence diagrams show the dependencies among variables. As illustrated below

Algebraic Models
An algebraic model takes a real-world situation described in words and describes that situation using algebra.
Some processes are so simple that they can be described in terms of algebraic equations, either explicitly, or implicitly as the solution to a differential equation. Algebraic equations are usually defined by applying some law of physics like conservation of mass or a time or space dependent equation describing the temporal movement of something. For example this is an explicit algebraic model: age = x – date of birth, where x is today’s date.
Spreadsheet Models
Spreadsheet formulae are used to relate various data values instead of algebraic equations or graphical representation. As spreadsheets are more widespread amongst business users, it is used for day to day decision making and modeling.