
Control Chart
Control charts in Process control can either be univariate when they monitor a single CTQ characteristic of a product or be multivariate when they monitor more than one CTQ. Moreover, the univariate control charts are further classified according to whether they monitor attribute data or variable data.
Four lines of a typical control chart
- Firstly, a vertical line to measure the levels of the sample’s means.
- Then, the two outmost horizontal lines for the UCL and the LCL.
- Lastly, the centerline, which represents the mean of the process.
Control Charts Prevention
- The control charts help in preventing the process from going out of control by detecting the assignable causes of variation in time.
- Moreover, it also determines the control limits of a process for comparing the range to specify its limits.
- Above all, it is a tool for constant process monitoring. Thus, facilitating the planning of production resources allocation.
As per the Western Electric (WECO) rules, a process is said to be out-of-control if one the following occur,
- A single point falls outside the 3σ limit
- Two out of three successive points fall beyond the 2σ limits
- Four out of five successive points fall beyond 1σ from the mean
- Eight successive points fall on one side of the centerline
Attribute Data univariate chart
The characteristics resemble binary data to take only one of two given forms like conforming or not conforming, good or bad, etc. Transforming of Attribute data into discrete data must be meaningful.
Types of Chart for Attribute data
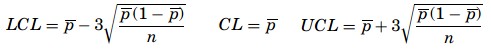
The p–chart:
- The p-chart is used when dealing with ratios, proportions, or percentages of conforming or nonconforming parts in a given sample. Moreover, the probability distribution in this context is the binomial distribution with p for the nonconforming proportion. And, q (which is equal to 1 − p) for the proportion of conforming items. The mean proportion is computed as,
![]()

where k is the number of samples audited and pk is the kth proportion obtained. The control limits of a p-chart are,

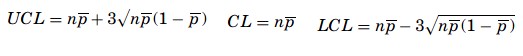
The np-chart:
- The np-chart is one of the easiest to build. As the np-chart plots the number of nonconforming items per sample. Moreover, the audit process of the samples follows a binomial distribution. Therefore, the mean number of successes is np. The control limits for an np-chart are,

The c-chart:
- The c-chart monitors the process variations due to the fluctuations of defects per item or group of items. Moreover, the c-chart is useful for the process engineer to know not just how many items are not conforming but how many defects there are per item.
- If c is the average nonconformity on a sample, the UCL and the LCL limits will be given as,
![]()

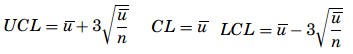
The u-chart:
- In this, the sample sizes can vary when a u-chart is monitoring the quality of the production process. Moreover, the u-chart does not require any limit to the number of potential defects.
- Above all, after determining all the averages, the mean of the distribution is to be computed as,
![]()

where k is the number of samples. The control limits are determined based on u and the mean of the samples, n as

Variable control charts
- Control charts monitor not only the means of the samples for CTQ characteristics but also the variability of those characteristics.
- Moreover, there is the use of the X -charts, S-charts, and R-charts when the characteristics measurement of variable data is done.
- Above all, the idea is to determine the mean, the standard deviation, and the distance between the mean and the control limits based on the standard deviation.
Various charts:
Charts and R-charts:
- It is similar to attribute control charts but, quantitative measurements are for the CTQ characteristics instead of qualitative attributes.
- The determination of CL is by averaging the s as, =(++)/n where n is the number of samples.
- And, the UCL= + 3σ, CL= and LCL= + 3σ. Here, σ =R/d2 where the constant d2 is a function of n.
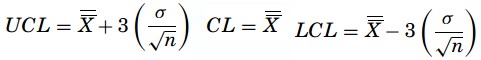
Standard error-based X-chart:
- It is based on the Central Limit Theorem. The formula for this is,

Mean range- based X-chart:
- With sample sizes n ≤ 10, the variations are also small, so the use of the range is against the standard deviation when constructing a control chart. Here, R is called the relative range where R = d2/σ and the mean range is R = (R1 + R2+··Rk)/k where Rk is the range of the kth sample. Therefore, the estimator of σ is σ =R/d2.
The formulas for the control limits are,
![]()

R-chart:
- In this, the centerline will be R and the estimator of sigma is given as σ R = d3σ. The control limits are,
![]()

Learn and enhance your knowledge in Control Chart in process control. Become a Certified TQM Professional Now!