
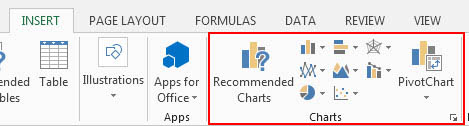
Charts allow you to present information contained in the worksheet in a graphic format. Excel offers many types of charts including: Column, Line, Pie, Bar, Area, Scatter and more. To view the charts available click the Insert Tab on the Ribbon.
Create a Chart
To create a chart:
- Select the cells that contain the data you want to use in the chart
- Click the Insert tab on the Ribbon
- Click the type of Chart you want to create

Modify a Chart
Once you have created a chart you can do several things to modify the chart.
To move the chart:
- Click the Chart and Drag it another location on the same worksheet, or
- Click the Move Chart button on the Design tab
- Choose the desired location (either a new sheet or a current sheet in the workbook)

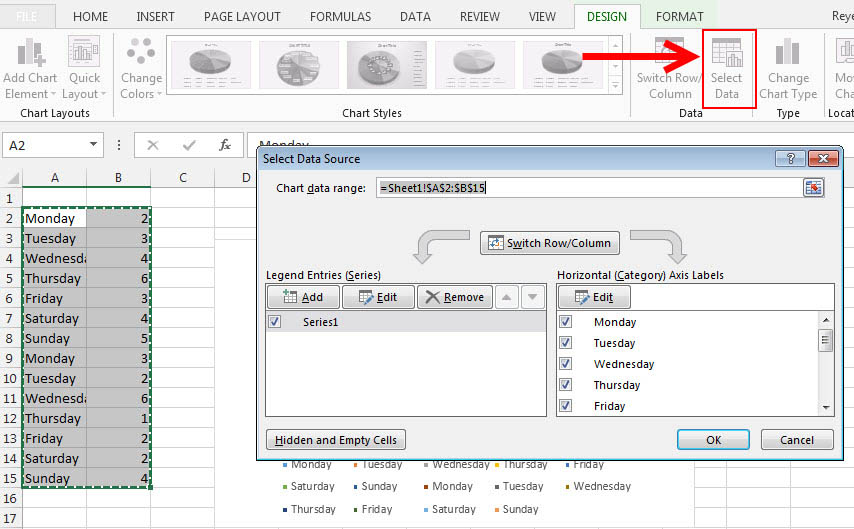
To change the data included in the chart:
- Click the Chart
- Click the Select Data button on the Design tab

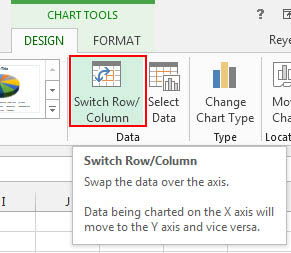
To reverse which data are displayed in the rows and columns:
- Click the Chart
- Click the Switch Row/Column button on the Design tab

To modify label and titles:
- Click the Chart
- Click the Chart Title or the Data Labels button
- Change the Title and click away

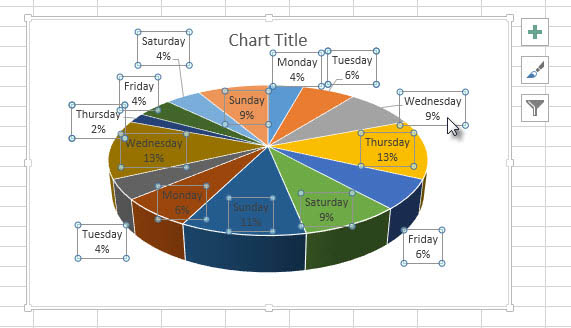
Chart Tools
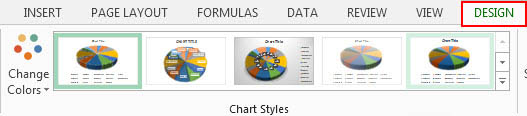
The Chart Tools appear on the Ribbon when you click on the chart. The tools are located on three tabs: Design, Layout, and Format.
- Within the Design tab you can control the chart layouts, styles, data, type, and location.

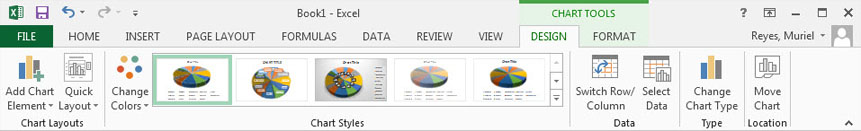
- Within the Format tab you can modify shape styles, word styles and size of the chart.