
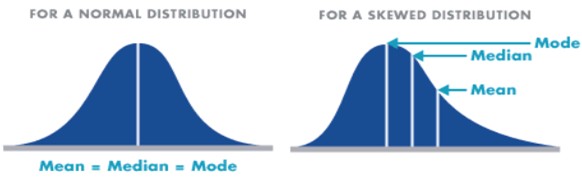
Central Tendency
Central tendency is a measure that characterizes the central value of a collection of data that cluster somewhere between the high and low values in the data.
- Moreover, it includes measurements like mean, median and mode. And, it is also known as measures of center.
- Above all, it involves plotting data in a frequency distribution which shows the general shape of the distribution.
Statistics Types
Several statistics are there in the “center” of the distribution.
Mean
The mean is the most common measure of central tendency. Moreover, it is the ratio of the sum of the scores to the number of scores. And, for data not in group intervals, the arithmetic mean is the sum of all the values in that population divide the number of values in the population as


And for data in the group, an approximation is done using the midpoints of the intervals and the frequency of the distribution as
![]()

Median
It divides the distribution into halves. However, half are above it and half are below it when the data arrange in numerical order.
Formula (N + 1) / 2 is for finding the median location of N numbers. Moreover, When N is an odd number, the formula yields an integer that represents the value in a numerical distribution.
Mode
It is the most frequent or common score in the distribution or the point or value of X that corresponds to the highest point on the distribution. Moreover, the distribution is multimodal, if the highest frequency is share with more than one value. Similarly, if share with two, it is bimodal or peaks in scoring at two different points in the distribution.

Enhance your Central Tendency skills and learn more about it. Become a Certified TQM Professional Now!